「温室効果ガス排出量」CO2補償は全体的に不足している
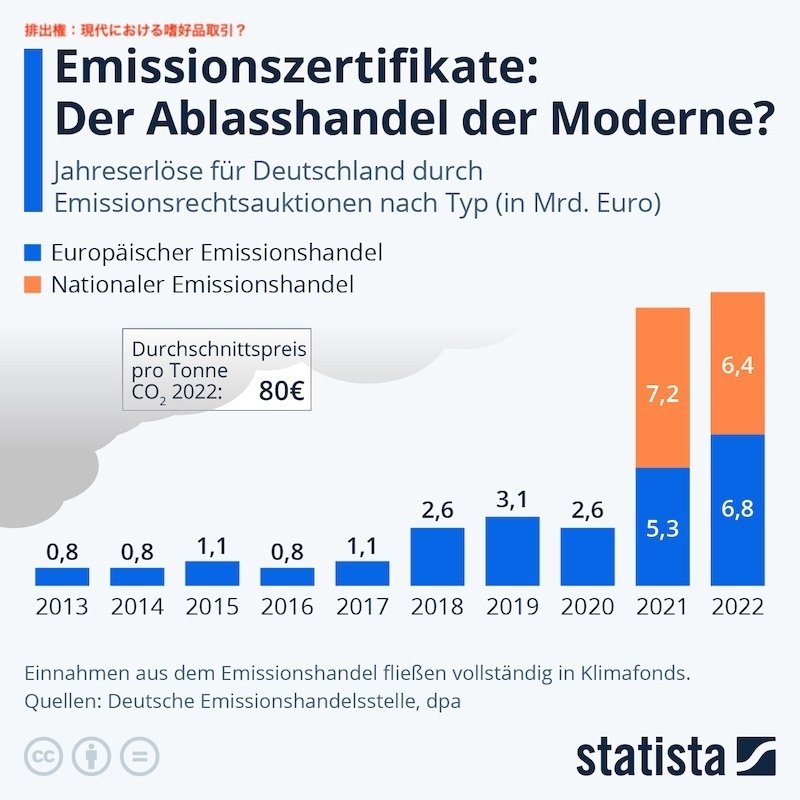
世界最大の統計調査データプラットフォームでドイツのインフォグラフィクスを紹介しているハンブルク(Stadt Hamburg)にあるStatista GmbHのデータ・ジャーナリスト(data Journalist)のフローリアン・ツァント(Florian Zandt)の報告として、リュウ・シャンホン(Shanhong Liu/劉 珊紅)、ティアス・ブラント(Mathias Brandt)の報告と共に2023年02月07日に、CO2証書の取引(Der Handel mit CO2-Zertifikaten existiert)は、2005年からすでに欧州レベルで存在しており、2021年10月からドイツの超地域プログラム(überregionale Programm in Deutschland)では、国別の証書取引所によって補完されている。このような追加的な努力にもかかわらず、連邦共和国は、様々な取引チャネルを通じてのみ、世界のCO2排出量のシェアを相殺することに成功しているわけではない。


世界銀行(World Bank)とGlobal Carbon Projectのデータをもとに作成したグラフによると、ドイツは、証明書購入やCO2税などのプロジェクトによるカバー率では世界のトップ6に入っている。


2021年、ドイツは世界のCO2排出量の1.9%を占め、国レベルの排出量取引により世界の排出量の0.7%を相殺した。
ただし、南アフリカとメキシコの方が成績がいい。

両国とも、温室効果ガス排出量は全国一律の税金で相殺されており、北米州では全国規模の排出量取引所も設置されている。


各カテゴリーのトップで負けなしは、中華人民共和国。
東アジアの国は、全世界のCO2排出量のほぼ3分の1を占めているだけでなく、そのオフセット量も約9%に過ぎない。


数多くの経済分野で中国と競合する米国は、2021年の世界のCO2排出量の約13%を占めているが、包括的なオフセット戦略をとっていない。


また、EU全体でもCO2オフセットの取り組みが遅れている。世界の総排出量の約8%のうち、排出権取引でオフセットされているのは3.2%に過ぎない。


公式な情報筋によると、このような措置による収入は、気候保護やエネルギー転換の促進のためのさまざまなプロジェクトに充当されるとのことである。
ドイツでは、この目的のために「気候変動基金(Klima- und Transformationsfonds)」が存在し、連邦予算によると、2022年には証明書収入だけで約€130億が投入されるはずである。
しかし、個々の施策の効果については、繰り返し疑問視されている。
例えば、日本は2012年に気候変動を抑制するための税金を導入したが、2019年にはCO2排出量1トン当たりUS$3のみとなった。
Global Carbon Atlasによると、2021年には全世界で約371億トンのCO2が排出されており、2019年から2020年のコロナ元年までの間に20億近く減少したのは、それに応じて短命に終わったと言える。
1995年以降、CO2排出量は年間約140億トン増加し、約58%も増加している。
Empfehlung(推薦)
下記のドイツ語または英語を
で検索すると、それぞれの興味深いテーマにアクセスできます。
Klimawandel(気候変動)
Klimawandel in Deutschland(ドイツにおける気候変動)
Luftverschmutzung(大気汚染)
Energiewende(エネルギー転換)
Nachhaltigkeit(サステナビリティ)
Energiemarkt(エネルギー市場)
Verkehr(輸送)
Treibhausgasemissionen(温室効果ガス排出量)
Natur- und Umweltschutz(自然・環境保護)
Umweltaktivismus in Deutschland(ドイツにおける環境保護活動)
Klima als Fluchtursache(フライトの原因としての気候)
Meere und Ozeane(フライトの原因としての気候)
https://de.statista.com/infografik/29255/durch-steuern-zertifikate-abgedeckte-co2-emissionen-vs-anteil-an-co2-emissionen-pro-land-region/
https://de.statista.com/infografik/29040/jahreserloese-fuer-deutschland-durch-emissionsrechtsauktionen-nach-typ
https://de.statista.com/infografik/28091/europaeische-laender-mit-dem-hoechsten-co2-ausstoss-durch-privatfluege-und-deren-emissionsanteil/
https://de.statista.com/infografik/28069/klimafreundlichkeit-ausgewaehlter-kreuzschifffahrtsreedereien-nach-punkten/
https://de.statista.com/infografik/27996/nachhaltiger-reisen/
https://de.statista.com/infografik/27846/stromverbrauch-von-deutschen-rechenzentren-und-kleineren-it-installationen-pro-jahr/
https://de.statista.com/infografik/27609/umfrage-bedeutung-von-natur-und-nachhaltigkeit-auf-reisen/
https://de.statista.com/themen/2442/treibhausgasemissionen/#editorsPicks
https://de.statista.com/statistik/daten/studie/167877/umfrage/co-emissionen-nach-laendern-je-einwohner/
https://de.statista.com/statistik/daten/studie/1078829/umfrage/treibhausgasemissionen-der-deutschen-industrie-nach-branchen/
https://de.statista.com/statistik/daten/studie/312450/umfrage/treibhausgasemissionen-in-deutschland-nach-quellgruppe/
https://de.statista.com/themen/7993/klimawandel-in-deutschland/#topicOverview
https://de.statista.com/statistik/daten/studie/1274590/umfrage/kumulierte-co2-emissionen/
https://de.statista.com/statistik/daten/studie/164050/umfrage/waermste-jahre-in-deutschland-nach-durchschnittstemperatur/
https://de.statista.com/statistik/daten/studie/156695/umfrage/brutto-stromerzeugung-in-deutschland-nach-energietraegern-seit-2007/
