引退したEV用バッテリーを再生可能エネルギーの貯蔵に利用できる可能性。

米国のNSF(National Science Foundation/全米科学財団/国立科学財団)は2021年12月09日に、コーネル大学の研究者らは、NSFの一部資金援助を受けて、使用済みのEV(Electric Vehicle/電気自動車)用リチウムイオン電池(lithium-ion batteriesを持続的に再利用し、二酸化炭素排出量を削減する方法をまとめた研究報告を発表しました。
研究者らは、電池の化学的性質、再利用およびリサイクルが、リチウムイオンEV電池のエネルギー出力と環境への影響にどのような影響を及ぼすかを調査した。
Science Advances誌に掲載された分析結果によると、リサイクル前に再利用することで、リチウムイオンEV用電池の二酸化炭素排出量を最大17%削減できることがわかった。蓄電能力が低下した電池は、風力発電や太陽光発電の蓄電に再利用することが可能である。この研究は、性能ではなく持続可能性を追求したEV用リチウムイオン電池を製造するための鍵となる。
この研究の著者の一人であるフェンキ・ユ(Fengqi You)は、「引退したEVのバッテリーをどうするかは、大きな問題になるでしょう」と語っている。研究チームは、電池の製造方法、使用方法、リサイクル方法について、環境と経済のトレードオフを検討した。
「リチウムイオン電池は性能を重視して設計されており、リサイクルや二次利用は考慮されていません。」とフェンキ・ユは言う。リチウムイオン電池は通常、12年以内に寿命を迎え、自動車の動力源としての能力を失う。「リサイクルや再利用のために電池の設計を改善するという環境的な側面については、現在ほとんど議論されていない。
リチウムイオンEVバッテリーを分解し、中の原材料を取り出すリサイクル施設の需要は、現在供給を上回っている。今後、使用済みバッテリーのリサイクル量が増加するため、その需要は高まる一方である。
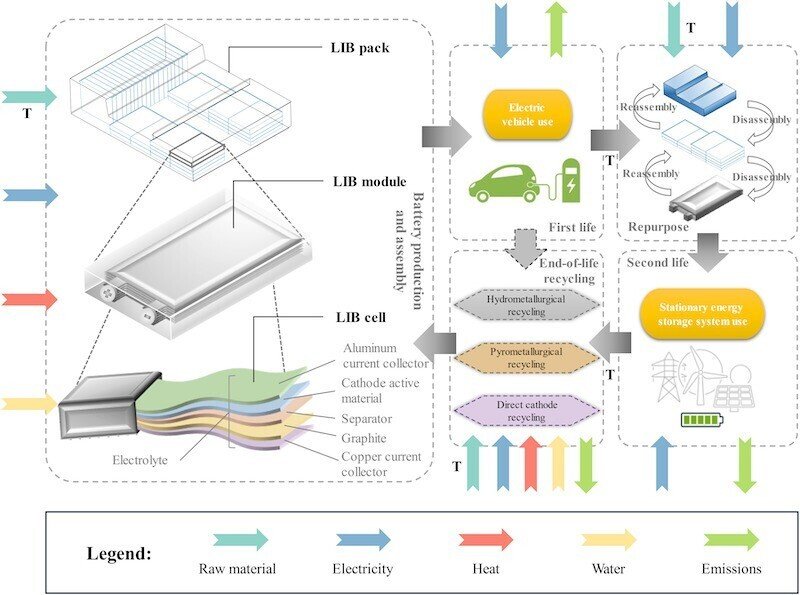
Fig. 1. System boundary of LIB life cycle with second life and three EOL alternatives, including hydrometallurgical, pyrometallurgical, and direct cathode recycling.
Transportation is abbreviated as T.
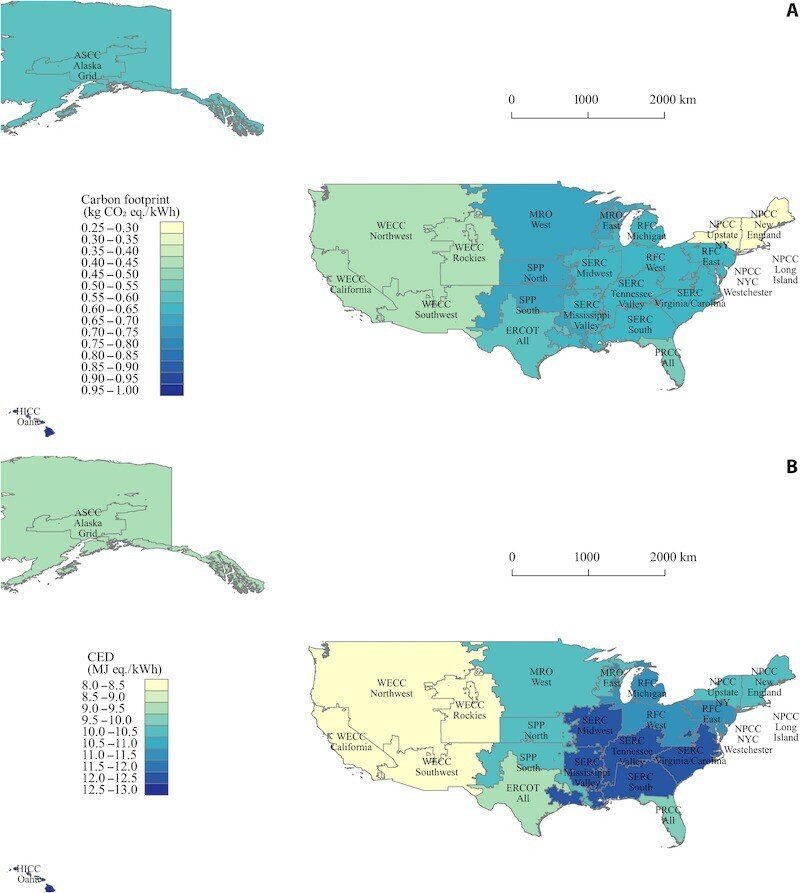
. 2. Carbon footprint and CED of power grid across U.S. independent system operators.
(A) Carbon footprint. (B) CED. WECC, Western Electricity Coordinating Council; MRO, Midwest Reliability Organization; SERC, Southeastern Electric Reliability Council; ERCOT, Electric Reliability Organization of Texas; FRCC, Florida Reliability Coordinating Council; RFC, Reliability First Corporation; ASCC, Alaska Systems Coordinating Council; HICC, Hawaiian Islands Coordinating Council; SPP, Southwest Power Pool.
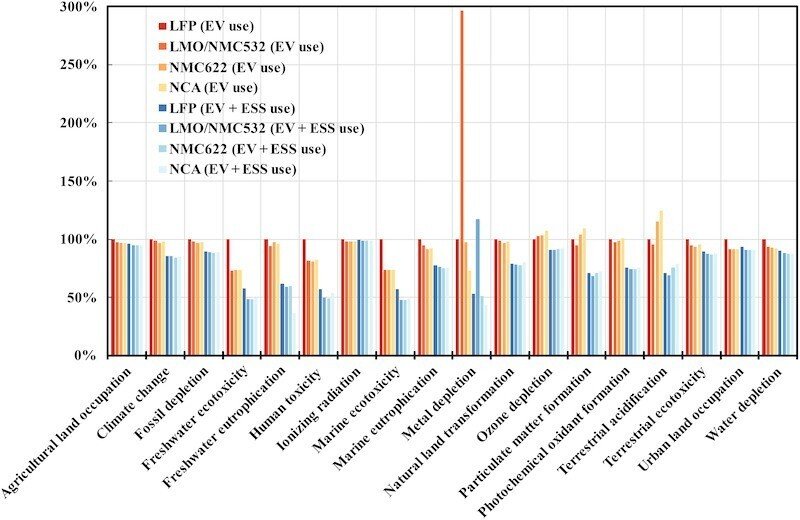
Fig. 3. Comparison of environmental impacts between different use scenarios for LFP, LMO/NMC532, NMC622, and NCA LIBs.
The environmental impacts of different recycling methods are averaged. Red and blue colors indicate life cycle environmental impacts associated with EV use scenario and cascaded use scenario, respectively. Darker color indicates lower pack energy density. For all 18 impact categories, the LFP LIB is defined as the reference for normalization.
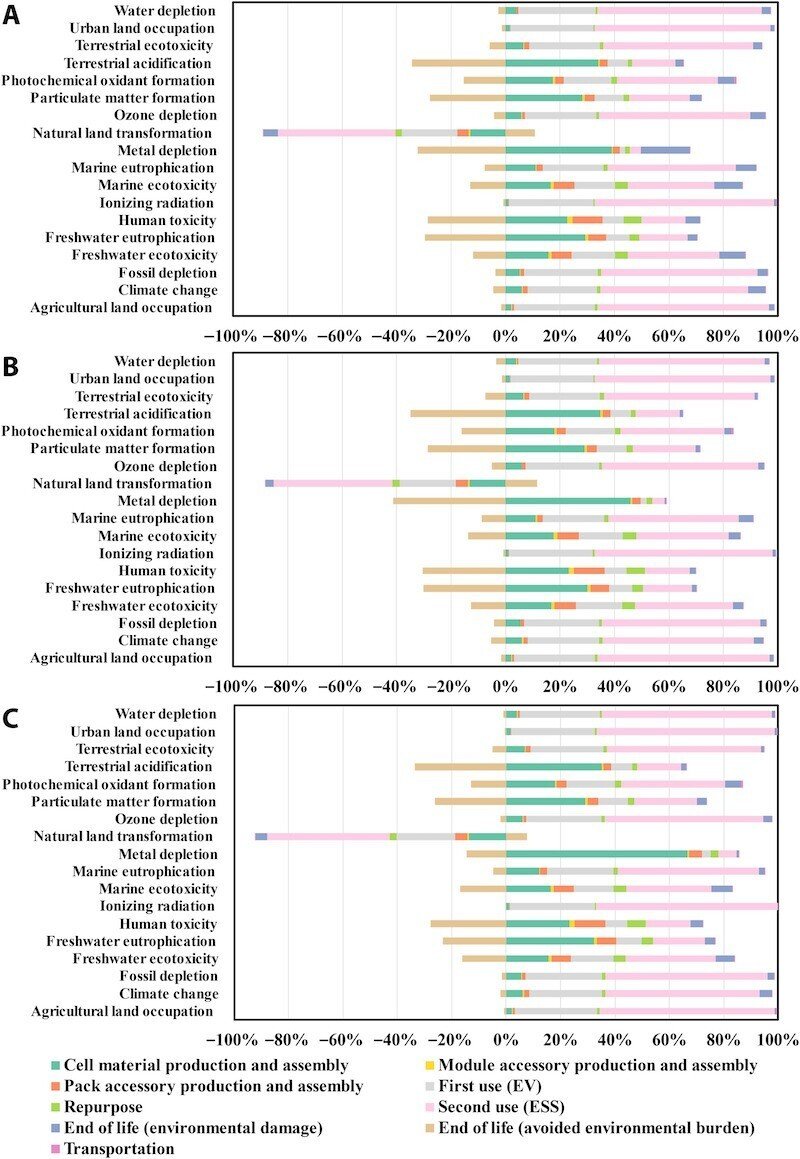
Fig. 4. Comparison of full-spectrum environmental profiles for LMO/NMC532 LIBs across different recycling methods.
Full-spectrum environmental profiles for LMO/NMC532 LIBs subjected to second life and recycled by (A) hydrometallurgical recycling, (B) direct cathode recycling, and (C) pyrometallurgical recycling on a percentage scale. Different colors in the stacked bars indicate different life cycle stages of LMO/NMC532 LIBs.
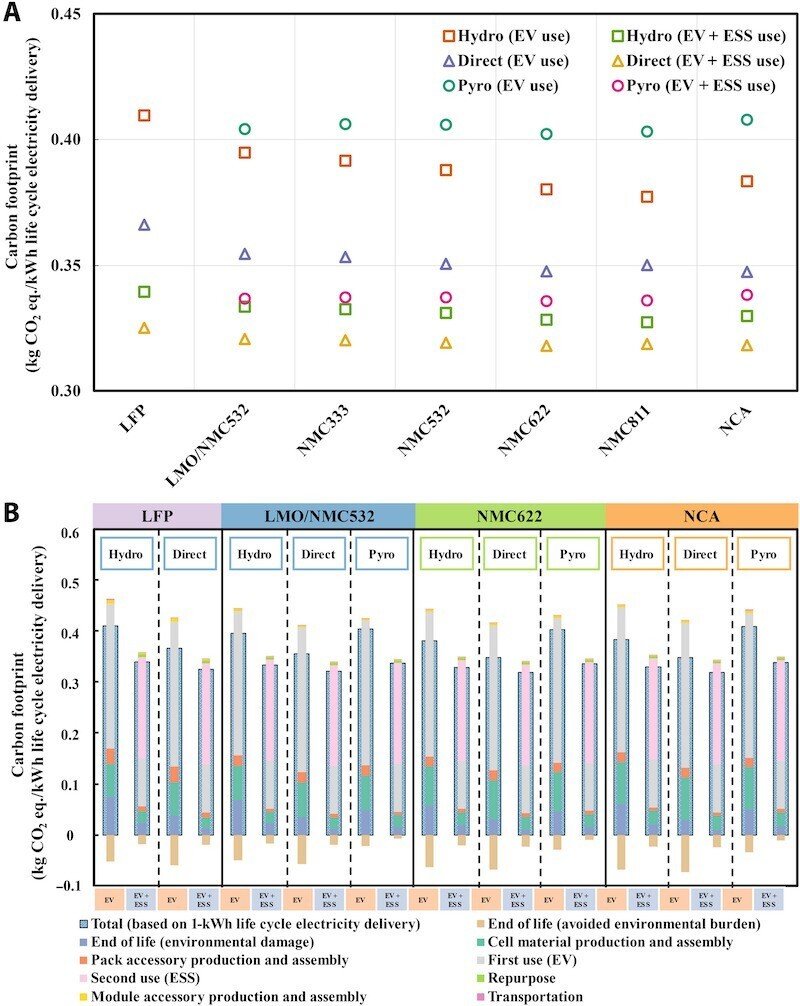
Fig. 5. of carbon footprint for the LFP, LMO/NMC532, NMC333, NMC532, NMC622, NMC811, and NCA LIBs with different EOL scenarios.
(A) Life cycle carbon footprint for the seven types of LIBs with different EOL scenarios. (B) Breakdowns of the carbon footprint for LFP, LMO/NMC532, NMC622, and NCA LIBs with different EOL scenarios. The stacked bar plot represents the breakdowns of carbon footprint per kilowatt-hour life cycle electricity delivered to the stage level. Different colors indicate different stages throughout LIB’s life cycle, as stated in the legend. The hydrometallurgical, direct cathode, and pyrometallurgical recycling are abbreviated as hydro, direct, and pyro.
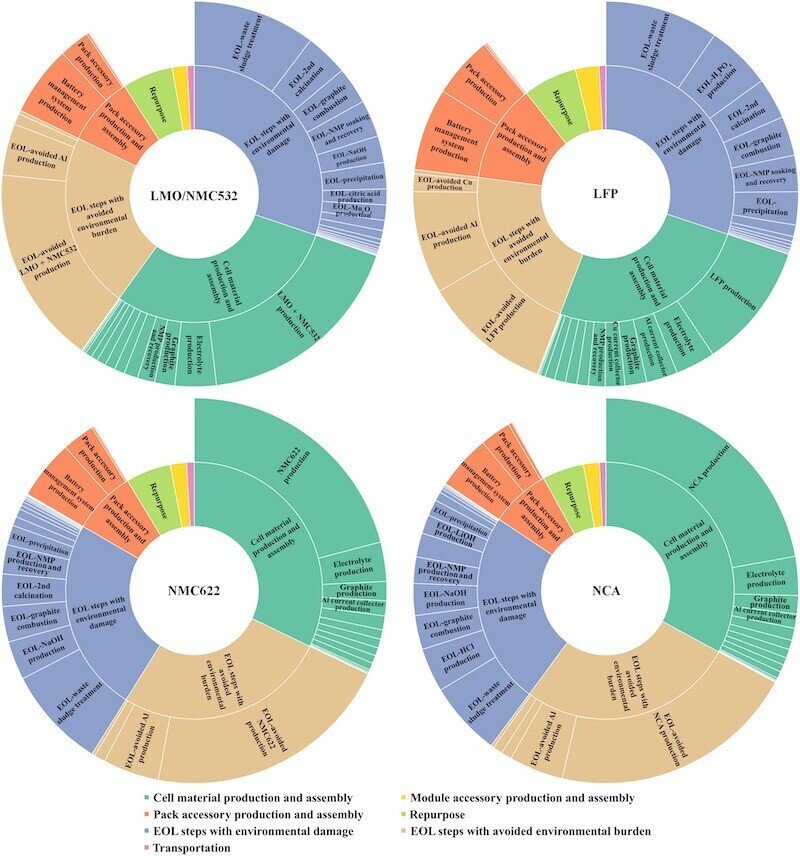
Fig. 6. Carbon footprint hotspots of LFP, LMO/NMC532, NMC622, and NCA LIBs with hydrometallurgical recycling.
The surrounding sunburst charts represent the hierarchical results of the carbon footprint from the life cycle stages to the process level. The inner circle represents the upper-level stages, while the outer circle represents the lower-level processes of each stage. The colors of stages and their corresponding processes are consistent, and the value of each process and stage is proportional to the angle of concentric circles. Moreover, starting from the top, the shares of the carbon footprint for stages become smaller in a clockwise order; within each stage, the shares of the carbon footprint for lower-level processes become smaller in the same manner.
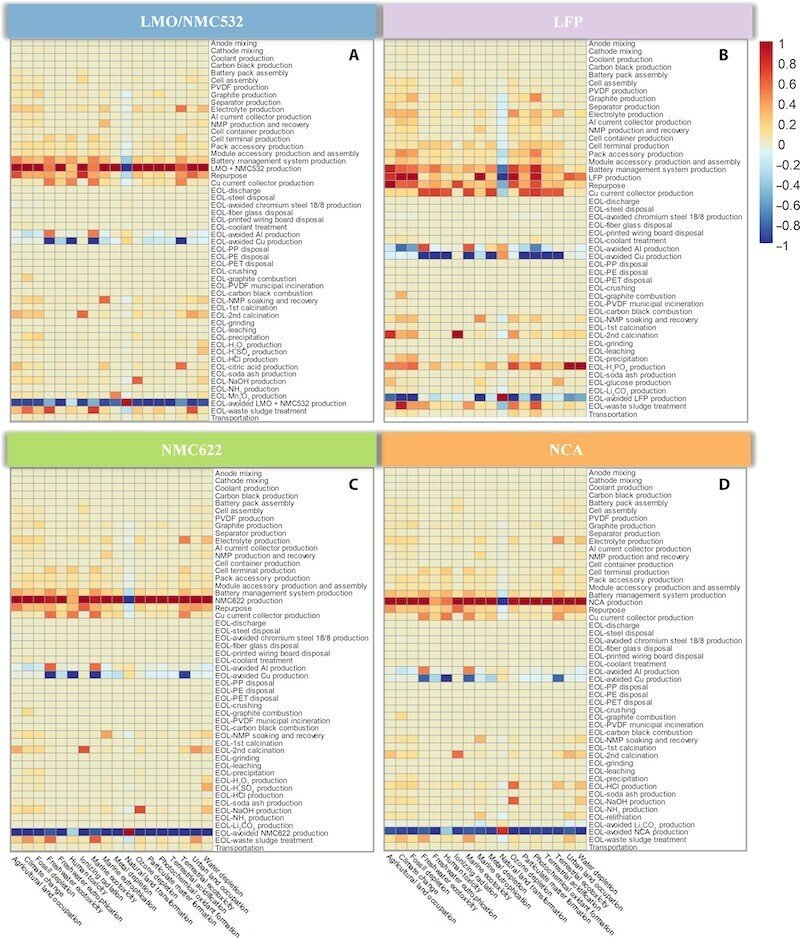
Fig. 7. Full-spectrum environmental hotspots for LFP, LMO/NMC532, NMC622, and NCA LIBs with hydrometallurgical recycling.
(A) Full-spectrum environmental hotspots for LMO/NMC532 with hydrometallurgical recycling. (B) Full-spectrum environmental hotspots for LFP with hydrometallurgical recycling. (C) Full-spectrum environmental hotspots for NMC622 with hydrometallurgical recycling. (D) Full-spectrum environmental hotspots for NCA with hydrometallurgical recycling. Use phases are excluded from the system boundary. Colors represent values corresponding to the environmental impacts of each process under each impact category. The values are normalized using the min-max normalization method and vary according to the colors presented on the color bar. In particular, the red color represents positive values and suggests damage to the environment; the blue color represents negative values and indicates an avoidance of environmental burden. Moreover, the darker color along each column implies more environmental impacts on the corresponding impact category. PET, polyethylene terephthalate; PP, polypropylene; PE, polyethylene.
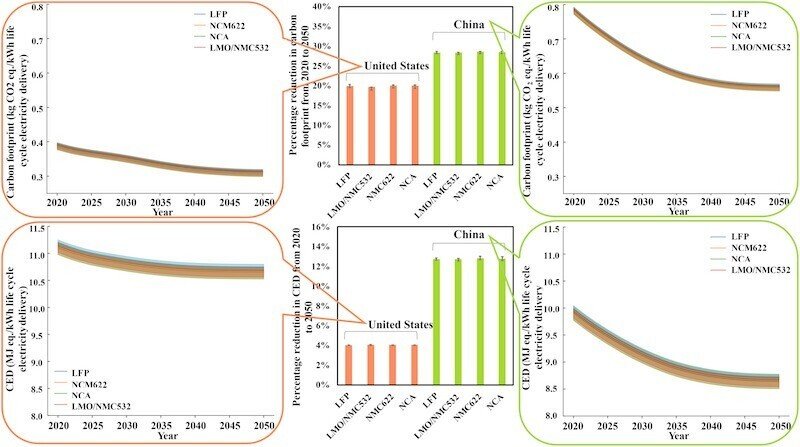
Fig. 8. Sensitivity analysis of temporal and spatial variations in electricity generation from 2020 to 2050 in the United States and China.
The horizontal axis represents the year when the LIBs are produced. The vertical axis represents the life cycle carbon footprint and CED for LIBs produced each year. Notably, the carbon footprint and CED of electricity production depend on the starting year of each life cycle stage.