ELISA等のデータから濃度を計算する

実現したこと
ELISA(Enzyme-Linked ImmunoSorbent Assay)は、生命科学研究において広く使用される定量的な分析手法です。
多くの人はプレートリーダーのソフトウェアで検量線演算をしているとおもいます。
しかし、これがまためんどくさいことが多いので、この計算をサクッとおこなうPythonスクリプトを紹介します。
スクリプトの概要
基本機能
ELISAアッセイの吸光度データを解析
4PLおよび5PLロジスティック回帰によるフィッティング
濃度計算
グラフの自動生成(matplotlib使用)
入力データ対応
Excelファイル (.xlsx) からのデータ読み込み
Replicate自動判定
複数サンプルの一括処理
解析機能
4PL/5PL自動選択機能(AICベース)
フィッティング品質の評価(R², Adjusted R², RMSE)
異常値や無効データの自動検出
スタンダードの検量線に基づく濃度計算
出力機能
結果のExcelファイル出力
サンプルごとのグラフ生成(PNG形式)
詳細なログ出力(verboseモード)をテキストファイルとして保存
フィッティング統計値のレポート
グラフ機能
フィッティングカーブの描画
実測値のプロット
カットオフラインの表示
サンプル中の濃度の視覚的表示
環境構築
Conda仮想環境構築
elisa_conc_calculation.ymlname: elisa_analysis
channels:
- conda-forge
- defaults
dependencies:
- python=3.12
- pandas
- numpy
- matplotlib
- scipy
- scikit-learn
- openpyxl
- argparse# 環境の作成
conda env create -f elisa_conc_calculation.yml
# 環境の有効化
conda activate elisa_analysisスクリプト
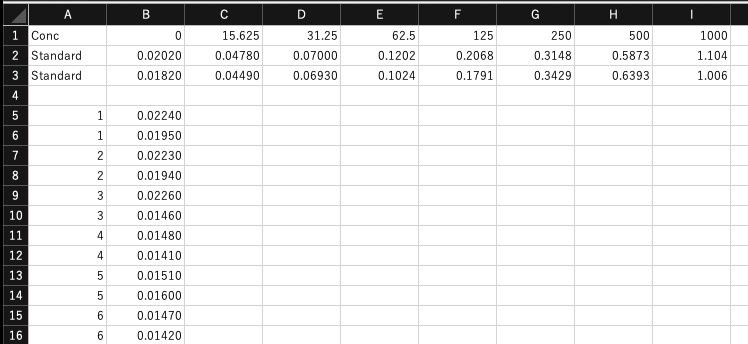
データファイルは下記のような構造です。
import openpyxl
from openpyxl.drawing.image import Image
import pandas as pd
import numpy as np
import matplotlib.pyplot as plt
from scipy.optimize import curve_fit
from scipy.optimize import fsolve
from scipy import stats
from sklearn.metrics import r2_score, mean_squared_error
import argparse
import sys
from pathlib import Path
from datetime import datetime
import logging
import json
import io
def setup_logging(output_dir, verbose):
"""
Set up logging configuration
Parameters:
-----------
output_dir : Path
Directory for log file output
verbose : bool
If True, set logging level to DEBUG
Returns:
--------
logger : Logger
Configured logger instance
"""
timestamp = datetime.now().strftime("%Y%m%d_%H%M%S")
log_file = output_dir / f'analysis_log_{timestamp}.txt'
logger = logging.getLogger('ELISA_Analysis')
logger.setLevel(logging.DEBUG)
# Configure file handler
fh = logging.FileHandler(log_file, encoding='utf-8')
fh.setLevel(logging.DEBUG)
# Configure console handler
ch = logging.StreamHandler()
ch.setLevel(logging.DEBUG if verbose else logging.INFO)
formatter = logging.Formatter('%(asctime)s - %(name)s - %(levelname)s - %(message)s')
fh.setFormatter(formatter)
ch.setFormatter(formatter)
logger.addHandler(fh)
logger.addHandler(ch)
return logger
def standardize_sample_names(sample_name):
"""
Standardize sample names by removing replicate indicators
Parameters:
-----------
sample_name : str or int or float
Sample name to standardize
Returns:
--------
str
Standardized sample name
"""
import re
if isinstance(sample_name, (int, float)):
return str(int(sample_name))
sample_name = str(sample_name).strip()
patterns = [
r'^(.*?)[_-][0-9A-Za-z]+$',
r'^(.*?)\([0-9A-Za-z]+\)$',
r'^(.*?)\s+[0-9A-Za-z]+$',
r'^(.*?)_Rep[0-9A-Za-z]+$',
r'^(.*?)-Rep[0-9A-Za-z]+$',
]
for pattern in patterns:
match = re.match(pattern, sample_name)
if match:
return match.group(1)
return sample_name
def validate_sample_names(sample_data):
"""Check consistency of sample names and return warnings"""
warnings = []
name_pairs = [(name, standardize_sample_names(name))
for name in sample_data['Sample']]
similar_names = {}
for orig_name, std_name in name_pairs:
if std_name not in similar_names:
similar_names[std_name] = []
similar_names[std_name].append(orig_name)
for std_name, orig_names in similar_names.items():
if len(orig_names) > 1:
warnings.append(
f"Warning: Similar sample names detected: "
f"{', '.join(orig_names)}"
f" -> Will use '{std_name}' as unified name"
)
return warnings
def four_pl(x, A, B, C, D):
"""
4-parameter logistic function
Parameters:
-----------
x : array-like
Input values
A : float
Maximum asymptote
B : float
Slope
C : float
EC50
D : float
Minimum asymptote
"""
return D + (A - D) / (1.0 + (x / C) ** B)
def five_pl(x, A, B, C, D, E):
"""
5-parameter logistic function
Additional parameter E controls asymmetry
"""
return D + (A - D) / (1.0 + (x / C) ** B) ** E
def linear_regression(x, y):
"""Perform linear regression and return the function and coefficients"""
coef = np.polyfit(x, y, 1)
return np.poly1d(coef), coef
def calculate_fit_metrics(y_true, y_pred, n_params):
"""
Calculate various metrics for evaluating the fit quality
Returns:
--------
dict
Contains R2, Adjusted R2, AIC, BIC, and RMSE values
"""
n = len(y_true)
residuals = y_true - y_pred
rss = np.sum(residuals**2)
tss = np.sum((y_true - np.mean(y_true))**2)
r2 = 1 - (rss/tss)
adj_r2 = 1 - ((1-r2)*(n-1)/(n-n_params-1))
aic = n * np.log(rss/n) + 2 * n_params
bic = n * np.log(rss/n) + n_params * np.log(n)
rmse = np.sqrt(np.mean(residuals**2))
return {
'R2': r2,
'Adjusted_R2': adj_r2,
'AIC': aic,
'BIC': bic,
'RMSE': rmse
}
def get_initial_params(y_data, x_data):
"""Get initial parameters for 4PL and 5PL curve fitting"""
A_init = np.max(y_data) * 1.05
D_init = np.min(y_data) * 0.95
B_init = 1.0
mid_response = (A_init + D_init) / 2
closest_idx = np.argmin(np.abs(y_data - mid_response))
C_init = x_data[closest_idx]
E_init = 1.0
return {
'A': A_init,
'B': B_init,
'C': C_init,
'D': D_init,
'E': E_init
}
def fit_curve(x_data, y_data, method, init_params=None, verbose=False):
"""
Fit curve using specified method
Parameters:
-----------
method : str
'linear', '4', or '5' for linear regression, 4PL, or 5PL respectively
"""
try:
if method == 'linear':
fit_func, coef = linear_regression(x_data, y_data)
y_fit = fit_func(x_data)
n_params = 2
formula = f"y = {coef[0]:.4f}x + {coef[1]:.4f}"
return fit_func, coef, y_fit, n_params, formula
elif method == '4':
bounds = ([0, 0.5, 0, 0], [np.inf, 10, np.inf, np.inf])
p0 = [init_params['A'], init_params['B'], init_params['C'], init_params['D']]
popt, pcov = curve_fit(four_pl, x_data, y_data, p0=p0, bounds=bounds, maxfev=50000)
y_fit = four_pl(x_data, *popt)
n_params = 4
formula = f"y = {popt[3]:.4f} + ({popt[0]:.4f} - {popt[3]:.4f}) / (1 + (x/{popt[2]:.4f})^{popt[1]:.4f})"
return four_pl, popt, y_fit, n_params, formula
else:
bounds = ([0, 0.5, 0, 0, 0.5], [np.inf, 10, np.inf, np.inf, 5])
p0 = [init_params['A'], init_params['B'], init_params['C'], init_params['D'], init_params['E']]
popt, pcov = curve_fit(five_pl, x_data, y_data, p0=p0, bounds=bounds, maxfev=50000)
y_fit = five_pl(x_data, *popt)
n_params = 5
formula = f"y = {popt[3]:.4f} + ({popt[0]:.4f} - {popt[3]:.4f}) / (1 + (x/{popt[2]:.4f})^{popt[1]:.4f})^{popt[4]:.4f}"
return five_pl, popt, y_fit, n_params, formula
except RuntimeError as e:
raise RuntimeError(f"Fitting failed: {str(e)}")
def inverse_fit_func(fit_func, absorbance, method, popt):
"""Calculate concentration from absorbance using the fitted function"""
if method == 'linear':
a, b = popt
return (absorbance - b) / a
else:
def func_to_solve(conc):
if method == '4':
return four_pl(conc, *popt) - absorbance
elif method == '5':
return five_pl(conc, *popt) - absorbance
else:
raise ValueError(f"Unsupported method: {method}")
x0 = 0.1 if absorbance <= 0 else 1.0
try:
concentration = fsolve(func_to_solve, x0=x0, full_output=True, xtol=1.49012e-8, maxfev=1000)
if concentration[2] == 1:
return float(concentration[0][0])
else:
raise RuntimeError("Failed to converge")
except:
try:
concentration = fsolve(func_to_solve, x0=100.0, full_output=True)
if concentration[2] == 1:
return float(concentration[0][0])
else:
return np.nan
except:
return np.nan
def read_input_file(file_path, sheet_name=None):
"""
Read input file (Excel or CSV)
Parameters:
-----------
file_path : str or Path
Path to input file
sheet_name : str, optional
Sheet name for Excel files
Returns:
--------
pd.DataFrame
Data frame containing the input data
str
File type ('excel' or 'csv')
"""
file_path = Path(file_path)
file_type = 'excel' if file_path.suffix.lower() in ['.xlsx', '.xls'] else 'csv'
try:
if file_type == 'excel':
df = pd.read_excel(file_path, sheet_name=sheet_name or 0)
else:
df = pd.read_csv(file_path)
return df, file_type
except Exception as e:
raise RuntimeError(f"Failed to read input file: {str(e)}")
def process_standard_data(df):
"""
Process standard data and automatically determine number of replicates
"""
empty_row_idx = df.index[df.iloc[:, 1:].isna().all(axis=1)].min()
standard_data = df.iloc[0:empty_row_idx, 1:].apply(pd.to_numeric, errors='coerce')
n_replicates = len(standard_data)
concentrations = df.columns[1:].astype(float)
mean_values = standard_data.mean(axis=0)
sd_values = standard_data.std(axis=0, ddof=1) if n_replicates > 1 else pd.Series(0, index=mean_values.index)
se_values = sd_values / np.sqrt(n_replicates) if n_replicates > 1 else pd.Series(0, index=mean_values.index)
return concentrations, mean_values, sd_values, se_values, n_replicates
def determine_best_fit(concentrations, mean_values, logger, verbose=False):
"""
Determine the best fitting method based on AIC and RMSE
"""
methods = ['linear', '4', '5']
best_method = None
best_metrics = None
best_y_fit = None
best_popt = None
best_formula = ""
best_fit_func = None
for method in methods:
try:
init_params = get_initial_params(mean_values, concentrations) if method in ['4', '5'] else None
fit_func, popt, y_fit, n_params, formula = fit_curve(concentrations, mean_values, method, init_params, verbose)
metrics = calculate_fit_metrics(mean_values, y_fit, n_params)
if best_metrics is None or metrics['AIC'] < best_metrics['AIC']:
best_method = method
best_metrics = metrics
best_y_fit = y_fit
best_popt = popt
best_formula = formula
best_fit_func = fit_func
elif metrics['AIC'] == best_metrics['AIC'] and metrics['RMSE'] < best_metrics['RMSE']:
best_method = method
best_metrics = metrics
best_y_fit = y_fit
best_popt = popt
best_formula = formula
best_fit_func = fit_func
except RuntimeError:
logger.warning(f"Fitting failed for {method} method")
return best_method, best_metrics, best_y_fit, best_popt, best_formula, best_fit_func
def process_sample_data(df, empty_row_idx, logger):
"""
Process sample data and automatically determine replicates
"""
from scipy import stats as scipy_stats
sample_data = df.iloc[empty_row_idx+1:, [0, 1]].dropna()
sample_data.columns = ['Sample', 'Absorbance']
sample_data['Sample'] = sample_data['Sample'].astype(str)
name_warnings = validate_sample_names(sample_data)
for warning in name_warnings:
logger.warning(warning)
sample_data['Original_Sample_Name'] = sample_data['Sample']
sample_data['Sample'] = sample_data['Sample'].apply(standardize_sample_names)
replicates_count = sample_data.groupby('Sample').size()
result_stats = []
for sample, group in sample_data.groupby('Sample'):
original_names = group['Original_Sample_Name'].tolist()
n = len(group)
mean_abs = group['Absorbance'].mean()
sd_abs = group['Absorbance'].std(ddof=1) if n > 1 else 0
se_abs = sd_abs / np.sqrt(n) if n > 1 else 0
if n > 1:
t_value = scipy_stats.t.ppf(0.975, n-1)
ci_95 = t_value * se_abs
else:
ci_95 = 0
cv_percent = (sd_abs / mean_abs * 100) if n > 1 else 0
result_stats.append({
'Sample': sample,
'Absorbance_Mean': mean_abs,
'Absorbance_SD': sd_abs,
'Absorbance_SE': se_abs,
'N': n,
'CI_95': ci_95,
'CV_Percent': cv_percent,
'Original_Names': original_names
})
return pd.DataFrame(result_stats)
def validate_data_quality(stats, cv_threshold=15):
"""
Check data quality and generate warnings
Parameters:
-----------
stats : DataFrame
Statistics for each sample
cv_threshold : float
CV threshold for warnings (percent)
"""
warnings = []
high_cv_samples = stats[stats['CV_Percent'] > cv_threshold]
if not high_cv_samples.empty:
for _, row in high_cv_samples.iterrows():
warnings.append(
f"Warning: {row['Sample']} has CV of {row['CV_Percent']:.1f}% (threshold: {cv_threshold}%)"
)
single_samples = stats[stats['N'] == 1]
if not single_samples.empty:
for _, row in single_samples.iterrows():
warnings.append(
f"Note: {row['Sample']} has only single measurement"
)
return warnings
def create_and_save_plot(concentrations, mean_values, sd_values, sample_stats,
fit_func, method, popt, formula, output_png_path, return_bytes=False):
"""
Create and save standard curve plot with sample data
Parameters:
-----------
...
return_bytes : bool
If True, returns the plot as bytes for Excel embedding
Returns:
--------
bytes or None
Plot as bytes if return_bytes is True, None otherwise
"""
plt.figure(figsize=(10, 8))
plt.errorbar(concentrations, mean_values, yerr=sd_values,
fmt='o', label="Standards (mean ± SD)",
capsize=5, color='blue', markersize=8)
x_vals = np.logspace(np.log10(min(concentrations)), np.log10(max(concentrations)), 500)
if method == 'linear':
plt.plot(x_vals, fit_func(x_vals), '-', label="Fitted Curve (Linear)",
color='red', linewidth=2)
else:
plt.plot(x_vals, fit_func(x_vals, *popt), '-',
label=f"Fitted Curve ({method}PL)",
color='red', linewidth=2)
for _, row in sample_stats.iterrows():
plt.errorbar(row['Concentration'], row['Absorbance_Mean'],
yerr=row['Absorbance_SD'] if row['N'] > 1 else None,
fmt='s', label=f"{row['Sample']} (n={row['N']})",
capsize=5, markersize=8)
plt.text(0.05, 0.95, formula, transform=plt.gca().transAxes,
fontsize=10, verticalalignment='top',
bbox=dict(facecolor='white', alpha=0.8))
plt.xscale('log')
plt.xlabel('Concentration', fontsize=12)
plt.ylabel('Absorbance', fontsize=12)
plt.title('Standard Curve with Sample Data', fontsize=14)
plt.grid(True, which="both", ls="-", alpha=0.2)
plt.legend(bbox_to_anchor=(1.05, 1), loc='upper left', fontsize=10)
plt.tight_layout()
# Save to file
plt.savefig(output_png_path, dpi=300, bbox_inches='tight')
# If requested, also return as bytes
if return_bytes:
buffer = io.BytesIO()
plt.savefig(buffer, format='png', dpi=300, bbox_inches='tight')
plt.close()
return buffer.getvalue()
plt.close()
return None
def save_results(output_path, sample_stats, metrics, formula, concentrations,
mean_values, sd_values, se_values, n_std_replicates, warnings,
fit_func, method, popt, output_png_path, file_type='excel'):
"""
Save analysis results to Excel/CSV file
"""
output_path = Path(output_path)
if file_type == 'excel':
workbook = openpyxl.Workbook()
with pd.ExcelWriter(output_path, engine='openpyxl') as writer:
# Sample analysis results
results_df = sample_stats.copy()
results_df['Original_Sample_Names'] = results_df['Original_Names'].apply(lambda x: ', '.join(x))
results_df = results_df.drop(columns=['Original_Names'])
results_df.to_excel(writer, sheet_name="Analysis_Results", index=False)
# Sample name mapping
name_mapping_df = pd.DataFrame({
'Standardized_Name': results_df['Sample'],
'Original_Names': results_df['Original_Sample_Names']
})
name_mapping_df.to_excel(writer, sheet_name="Sample_Name_Mapping", index=False)
# Standard data
std_data = pd.DataFrame({
'Concentration': concentrations,
'Mean_Absorbance': mean_values,
'SD': sd_values,
'SE': se_values,
'N': n_std_replicates
})
std_data.to_excel(writer, sheet_name="Standard_Data", index=False)
# Fitting metrics
metrics_df = pd.DataFrame({
'Metric': ['R²', 'Adjusted R²', 'RMSE', 'AIC', 'BIC'],
'Value': [metrics['R2'], metrics['Adjusted_R2'],
metrics['RMSE'], metrics['AIC'], metrics['BIC']]
})
metrics_df.to_excel(writer, sheet_name="Fitting_Metrics", index=False)
# Formula
pd.DataFrame({'Formula': [formula]}).to_excel(writer,
sheet_name="Formula", index=False)
# Warnings
if warnings:
pd.DataFrame({'Warnings': warnings}).to_excel(writer,
sheet_name="Quality_Checks", index=False)
# Add plot to a new sheet
workbook = writer.book
plot_sheet = workbook.create_sheet("Plot")
# Generate plot
plot_bytes = create_and_save_plot(
concentrations, mean_values, sd_values, sample_stats,
fit_func, method, popt, formula, output_png_path, return_bytes=True
)
# Add image to Excel
img = openpyxl.drawing.image.Image(io.BytesIO(plot_bytes))
plot_sheet.add_image(img, 'A1')
# Adjust column widths
for ws in workbook.worksheets:
for column in ws.columns:
max_length = 0
column = list(column)
for cell in column:
try:
if len(str(cell.value)) > max_length:
max_length = len(str(cell.value))
except:
pass
adjusted_width = (max_length + 2)
ws.column_dimensions[column[0].column_letter].width = adjusted_width
else:
# CSV output (same as before)
output_str = io.StringIO()
# Write sample analysis results
output_str.write("=== Analysis Results ===\n")
results_df = sample_stats.copy()
results_df['Original_Sample_Names'] = results_df['Original_Names'].apply(lambda x: ', '.join(x))
results_df = results_df.drop(columns=['Original_Names'])
results_df.to_csv(output_str, index=False)
# Write standard data
output_str.write("\n=== Standard Data ===\n")
std_data = pd.DataFrame({
'Concentration': concentrations,
'Mean_Absorbance': mean_values,
'SD': sd_values,
'SE': se_values,
'N': n_std_replicates
})
std_data.to_csv(output_str, index=False)
# Write fitting metrics
output_str.write("\n=== Fitting Metrics ===\n")
metrics_str = (
f"R²: {metrics['R2']:.6f}\n"
f"Adjusted R²: {metrics['Adjusted_R2']:.6f}\n"
f"RMSE: {metrics['RMSE']:.6e}\n"
f"AIC: {metrics['AIC']:.6f}\n"
f"BIC: {metrics['BIC']:.6f}\n"
)
output_str.write(metrics_str)
# Write formula
output_str.write("\n=== Formula ===\n")
output_str.write(formula + "\n")
# Write warnings
if warnings:
output_str.write("\n=== Quality Checks ===\n")
output_str.write("\n".join(warnings))
# Save to file
with open(output_path, 'w', encoding='utf-8') as f:
f.write(output_str.getvalue())
output_str.close()
def process_data_and_calculate_conc(file_path, sheet_name, output_path, method, logger, verbose=False):
"""Main function to process ELISA data and calculate concentrations"""
try:
# Prepare text file for storing calculation process
output_dir = Path(output_path).parent
timestamp = datetime.now().strftime("%Y%m%d_%H%M%S")
calculation_log_path = output_dir / f'calculation_process_{timestamp}.txt'
# Function to record calculation process
def log_to_file(message):
with open(calculation_log_path, 'a', encoding='utf-8') as f:
f.write(f"{message}\n")
# Record header information
log_to_file("=" * 80)
log_to_file(f"ELISA Analysis Calculation Process")
log_to_file(f"Analysis started at: {timestamp}")
log_to_file(f"Input file: {file_path}")
log_to_file(f"Fitting method: {method}")
log_to_file("=" * 80 + "\n")
logger.info(f"Starting analysis: {file_path}")
log_to_file("1. Reading input data...")
# Read data
df, file_type = read_input_file(file_path, sheet_name)
# Process standard data
log_to_file("\n2. Processing standard data:")
concentrations, mean_values, sd_values, se_values, n_std_replicates = process_standard_data(df)
# Record standard data details
log_to_file("\nStandard data summary:")
for conc, mean, sd, se in zip(concentrations, mean_values, sd_values, se_values):
log_to_file(f"Concentration {conc:8.3f}: Mean = {mean:.4f}, SD = {sd:.4f}, SE = {se:.4f}")
# Fitting process
log_to_file("\n3. Curve fitting:")
if method == 'auto':
log_to_file("\nPerforming automatic method selection...")
method, metrics, y_fit, popt, formula, fit_func = determine_best_fit(
concentrations, mean_values, logger, verbose)
log_to_file(f"Selected method: {method}")
else:
log_to_file(f"\nUsing specified method: {method}")
init_params = get_initial_params(mean_values, concentrations) if method in ['4', '5'] else None
if init_params:
log_to_file("\nInitial parameters:")
for param, value in init_params.items():
log_to_file(f" {param}: {value:.6f}")
fit_func, popt, y_fit, n_params, formula = fit_curve(
concentrations, mean_values, method, init_params, verbose)
metrics = calculate_fit_metrics(mean_values, y_fit, n_params)
# Record fitting results
log_to_file("\n4. Fitting results:")
log_to_file(f"Method: {method}")
log_to_file(f"Formula: {formula}")
log_to_file("\nMetrics:")
log_to_file(f" R² = {metrics['R2']:.6f}")
log_to_file(f" Adjusted R² = {metrics['Adjusted_R2']:.6f}")
log_to_file(f" RMSE = {metrics['RMSE']:.6e}")
log_to_file(f" AIC = {metrics['AIC']:.6f}")
log_to_file(f" BIC = {metrics['BIC']:.6f}")
# Process sample data
empty_row_idx = df.index[df.iloc[:, 1:].isna().all(axis=1)].min()
log_to_file("\n5. Processing sample data:")
sample_stats = process_sample_data(df, empty_row_idx, logger)
# Calculate concentrations
log_to_file("\n6. Calculating concentrations:")
sample_stats['Concentration'] = sample_stats['Absorbance_Mean'].apply(
lambda x: inverse_fit_func(fit_func, x, method, popt)
)
# Calculate concentration statistics
for stat in ['SD', 'SE']:
stat_col = f'Absorbance_{stat}'
if stat_col in sample_stats.columns:
sample_stats[f'Concentration_{stat}'] = sample_stats.apply(
lambda row: (
inverse_fit_func(fit_func, row['Absorbance_Mean'] + row[stat_col], method, popt) -
inverse_fit_func(fit_func, row['Absorbance_Mean'] - row[stat_col], method, popt)
) / 2,
axis=1
)
if 'Absorbance_SE' in sample_stats.columns:
sample_stats['Concentration_CI_95'] = sample_stats.apply(
lambda row: (
inverse_fit_func(fit_func, row['Absorbance_Mean'] + row['CI_95'], method, popt) -
inverse_fit_func(fit_func, row['Absorbance_Mean'] - row['CI_95'], method, popt)
) / 2 if row['N'] > 1 else np.nan,
axis=1
)
# Record sample results
log_to_file("\nSample results:")
for _, row in sample_stats.iterrows():
log_to_file(f"\nSample: {row['Sample']}")
log_to_file(f" Absorbance: {row['Absorbance_Mean']:.4f} ± {row['Absorbance_SD']:.4f}")
log_to_file(f" Calculated concentration: {row['Concentration']:.4f}")
# Data quality check
warnings = validate_data_quality(sample_stats)
if warnings:
log_to_file("\n7. Quality warnings:")
for warning in warnings:
log_to_file(f" {warning}")
# Create plot
plot_png_path = Path(output_path).with_suffix('.png')
log_to_file("\n8. Creating plots and saving results...")
create_and_save_plot(
concentrations, mean_values, sd_values, sample_stats,
fit_func, method, popt, formula, plot_png_path
)
# Save results
save_results(
output_path, sample_stats, metrics, formula,
concentrations, mean_values, sd_values, se_values,
n_std_replicates, warnings, fit_func, method, popt,
plot_png_path, file_type=file_type
)
# Completion message
log_to_file("\n" + "=" * 80)
log_to_file("Analysis completed successfully")
log_to_file(f"Results saved to: {output_path}")
log_to_file(f"Plot saved to: {plot_png_path}")
log_to_file(f"Calculation process log saved to: {calculation_log_path}")
log_to_file("=" * 80)
logger.info("\nAnalysis completed")
logger.info(f"Results file: {output_path}")
logger.info(f"Plot image: {plot_png_path}")
logger.info(f"Calculation log: {calculation_log_path}")
return len(sample_stats)
except Exception as e:
error_msg = f"Error occurred during processing: {str(e)}"
logger.error(error_msg)
log_to_file(f"\nERROR: {error_msg}")
raise
def main():
"""Main entry point"""
parser = argparse.ArgumentParser(description='ELISA Analysis Tool')
parser.add_argument('--input', '-i', required=True, help='Input Excel/CSV file')
parser.add_argument('--sheet', '-s', help='Sheet name (for Excel files)')
parser.add_argument('--method', '-m', choices=['4', '5', 'linear', 'auto'],
default='4', help='Fitting method (4: 4PL, 5: 5PL, linear, auto)')
parser.add_argument('--output', '-o', help='Output file path (default: results_[input_name].[xlsx/csv])')
parser.add_argument('--output-format', '-f', choices=['excel', 'csv'],
help='Output format (default: same as input)')
parser.add_argument('--verbose', '-v', action='store_true', help='Display detailed output')
args = parser.parse_args()
input_path = Path(args.input)
# Determine input and output formats
input_format = 'excel' if input_path.suffix.lower() in ['.xlsx', '.xls'] else 'csv'
output_format = args.output_format or input_format
# Set default output path if not specified
if not args.output:
output_suffix = '.xlsx' if output_format == 'excel' else '.csv'
output_path = input_path.parent / f'results_{input_path.stem}{output_suffix}'
else:
output_path = Path(args.output)
logger = setup_logging(input_path.parent, args.verbose)
try:
num_samples = process_data_and_calculate_conc(
args.input, args.sheet, output_path, args.method, logger, args.verbose
)
logger.info(f"Processing completed: analyzed {num_samples} samples")
return 0
except Exception as e:
logger.error(f"Error occurred: {str(e)}")
return 1
if __name__ == '__main__':
exit(main())使用例
elisa_conc_calculation.py --help
usage: elisa_conc_calculation.py [-h] --input INPUT [--method {4,5,linear,auto}] [--verbose]

usage: standard_curve_analysis.py [-h] --input INPUT [--sheet SHEET]
                                [--method {4,5,linear,auto}] [--output OUTPUT]
                                [--output-format {excel,csv}] [--verbose]

Standard Curve Analysis Tool

options:
  -h, --help            show this help message and exit
  --input INPUT, -i INPUT
                        Input Excel/CSV file
  --sheet SHEET, -s SHEET
                        Sheet name (for Excel files)
  --method {4,5,linear,auto}, -m {4,5,linear,auto}
                        Fitting method (4: 4PL, 5: 5PL, linear, auto)
  --output OUTPUT, -o OUTPUT
                        Output file path (default: results_[input_name].[xlsx/csv])
  --output-format {excel,csv}, -f {excel,csv}
                        Output format (default: same as input)
  --verbose, -v         Display detailed output       Display detailed output


# Basic usage with 4PL fitting (default)
python elisa_conc_calculation.py -i "path/to/data.xlsx"

# Use 5PL fitting
python elisa_conc_calculation.py -i "path/to/data.xlsx" -m 5

# Use linear regression
python elisa_conc_calculation.py -i "path/to/data.xlsx" -m linear

# Auto-select best fitting method
python elisa_conc_calculation.py -i "path/to/data.xlsx" -m auto

# Show detailed output
python elisa_conc_calculation.py -i "path/to/data.xlsx" -v
まとめ
これで、検量線からの濃度計算が出来るようになりました。
これで教育・研究活動に時間が使えるようになりハッピーになると良いですね。
他にも色々と解析に使えるスクリプトがありますので、都度紹介します!
質問や改善点があれば、ぜひコメントで教えてください。