Calculating Antibody Titers (Endpoint Titers)

Achievement
The quantification of antibody titers in biological samples plays a crucial role in various scientific fields. One widely employed method is the determination of endpoint titers, which involves a systematic dilution approach.
The conventional procedure entails performing serial dilutions of the sample until the absorbance value falls below a predetermined threshold. This critical point is typically identified as the endpoint titer.
In standard laboratory practice, the cutoff value is commonly established at twice the mean absorbance of the blank samples. This approach provides a reliable baseline for determining significant antibody presence.
To streamline this analytical process, I will present a Python script that efficiently performs these calculations. This computational tool facilitates rapid and accurate determination of endpoint titers.
Script Overview: Automated Antibody Titer Analysis System
Core Functionalities
Primary Analysis Capabilities
Analysis of ELISA assay absorbance data
Implementation of 4PL and 5PL logistic regression fitting algorithms
Automated calculation of antibody titers
Automated graph generation utilizing matplotlib library
Data Input Management
Data Source Compatibility
Direct data extraction from Excel files (.xlsx) or CSV files
Batch processing of multiple samples
Automated dilution factor calculations with formula support
Analytical Features
Advanced Statistical Analysis
Automated selection between 4PL/5PL models based on AIC criteria
Assessment of fitting quality through multiple parameters:
R² (coefficient of determination)
Adjusted R²
Root Mean Square Error (RMSE)
Automated detection of outliers and invalid data points
Calculation of antibody titers based on established cutoff values
Output Capabilities
Comprehensive Result Documentation
Generation of Excel-formatted results
Individual sample graph production in PNG format
Detailed logging functionality in verbose mode
Comprehensive fitting statistics reports
Graphical Representation
Visualization Features
Display of fitting curves
Plotting of experimental data points
Visual representation of cutoff thresholds
Clear indication of antibody titer values
Environmental Setup
Implementation through Conda virtual environment
nano endpoint-titer.ymlname: endpoint-titer-analysis
channels:
- conda-forge
- defaults
dependencies:
- python=3.12
- numpy
- pandas
- scipy
- openpyxl
- matplotlib# Create the analytical environment
conda env create -f endpoint-titer.yml
# Activate the analytical environment
conda activate endpoint-titer-analysisScript
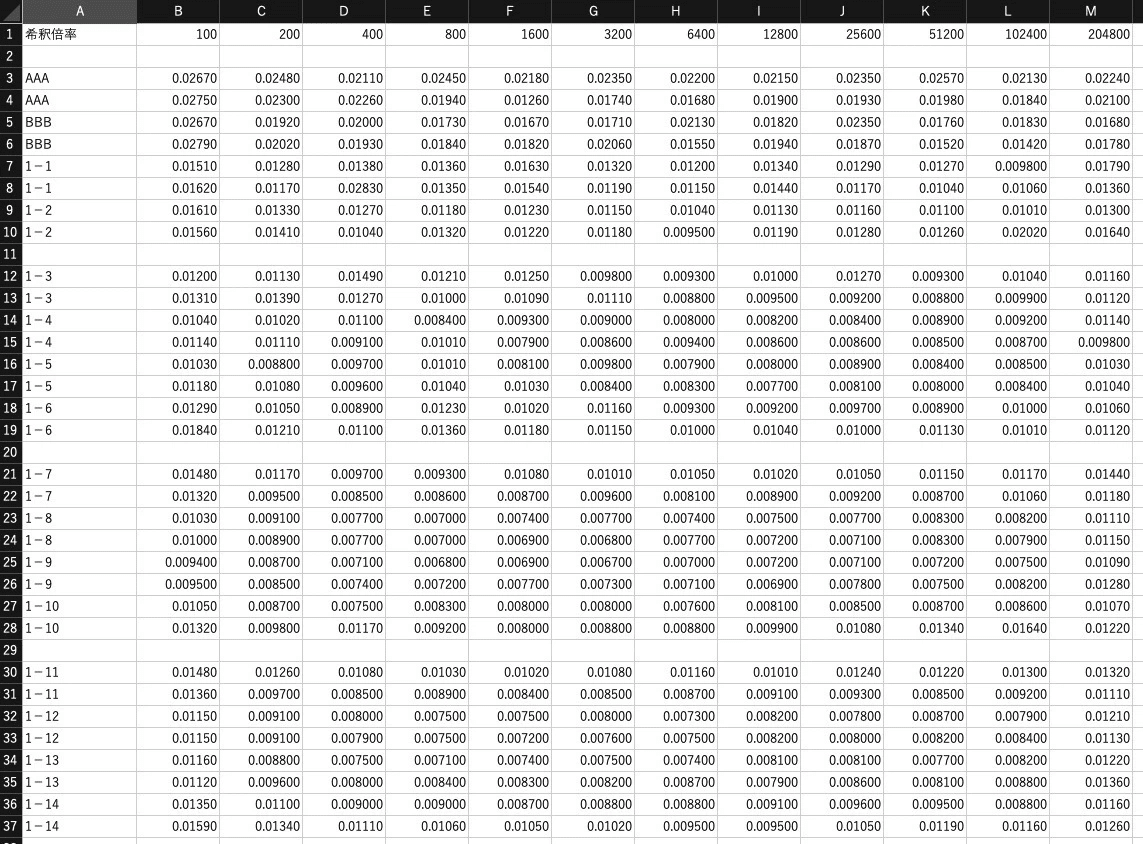
Data File Structure Specification
import openpyxl
import pandas as pd
import numpy as np
import matplotlib
matplotlib.use('Agg')
import matplotlib.pyplot as plt
from matplotlib import font_manager
from scipy.optimize import curve_fit
from openpyxl.drawing.image import Image
import io
import argparse
from pathlib import Path
import sys
import platform
import os
# Function to set the appropriate font based on the OS
def set_japanese_font():
system_os = platform.system()
if system_os == "Darwin": # macOS
jp_font_path = "/System/Library/Fonts/ヒラギノ角ゴシック W6.ttc" # Hiragino Sans
elif system_os == "Windows": # Windows
jp_font_path = "C:/Windows/Fonts/msgothic.ttc" # MS Gothic
else:
raise EnvironmentError("Unsupported operating system for this script")
# Load and set the font
jp_font = font_manager.FontProperties(fname=jp_font_path)
plt.rcParams['font.family'] = jp_font.get_name()
return jp_font
def four_pl(x, A, B, C, D):
"""4-Parameter Logistic Regression"""
return D + (A-D)/(1.0+((x/C)**B))
def five_pl(x, A, B, C, D, E):
"""5-Parameter Logistic Regression"""
return D + (A-D)/(1.0+((x/C)**B))**E
def load_data(file_path, sheet_name='Sheet1', encoding='utf-8'):
"""
Function to load data from Excel or CSV files
Parameters:
-----------
file_path : str or Path
Input file path (Excel or CSV)
sheet_name : str
Sheet name for Excel files
encoding : str
CSV file encoding (default: utf-8)
Returns:
--------
pd.DataFrame
Loaded data
"""
file_path = Path(file_path)
file_extension = file_path.suffix.lower()
if file_extension in ['.xlsx', '.xls']:
# Load Excel file
wb = openpyxl.load_workbook(file_path)
sheet = wb[sheet_name]
data = []
for row in sheet.iter_rows(values_only=True):
data.append(row)
df = pd.DataFrame(data)
elif file_extension == '.csv':
# Load CSV file
try:
df = pd.read_csv(file_path, header=None, encoding=encoding)
except UnicodeDecodeError:
# Try with CP932 (Windows Japanese) if UTF-8 fails
if encoding == 'utf-8':
df = pd.read_csv(file_path, header=None, encoding='cp932')
else:
raise
# Format CSV data to match Excel format
if len(df.columns) < 13:
raise ValueError("CSV file must have at least 13 columns (sample name + 12 data points")
else:
raise ValueError(f"Unsupported file format: {file_extension}")
return df
def evaluate_dilution_rates(dilution_rates):
"""Evaluate and convert dilution rates to numerical values"""
evaluated_rates = []
for i, rate in enumerate(dilution_rates):
if isinstance(rate, (int, float)):
evaluated_rates.append(float(rate))
elif isinstance(rate, str):
if rate.startswith('='):
parts = rate.split('*')
if len(parts) == 2 and parts[1].isdigit():
if i == 0:
evaluated_rates.append(float(parts[1]))
else:
evaluated_rates.append(evaluated_rates[-1] * int(parts[1]))
else:
try:
evaluated_rates.append(float(eval(rate[1:])))
except:
print(f"Warning: Could not evaluate value '{rate}'")
return None
else:
try:
evaluated_rates.append(float(rate))
except ValueError:
print(f"Warning: Could not convert value '{rate}' to number")
return None
else:
print(f"Warning: Unknown type of value '{rate}'")
return None
return evaluated_rates
def calculate_fit_metrics(y_true, y_pred, n_params):
"""Calculate fitting quality metrics"""
n = len(y_true)
residuals = y_true - y_pred
rss = np.sum(residuals**2)
tss = np.sum((y_true - np.mean(y_true))**2)
r2 = 1 - (rss/tss)
adj_r2 = 1 - ((1-r2)*(n-1)/(n-n_params-1))
aic = n * np.log(rss/n) + 2 * n_params
bic = n * np.log(rss/n) + n_params * np.log(n)
rmse = np.sqrt(np.mean(residuals**2))
return {
'R2': r2,
'Adjusted_R2': adj_r2,
'AIC': aic,
'BIC': bic,
'RMSE': rmse
}
def get_initial_params(y_data, dilution_rates):
"""Optimized initial parameter estimation"""
A_init = np.max(y_data) * 1.05
D_init = np.min(y_data) * 0.95
B_init = 1.0
mid_response = (A_init + D_init) / 2
closest_idx = np.argmin(np.abs(y_data - mid_response))
C_init = dilution_rates[closest_idx]
E_init = 1.0
return {
'A': A_init,
'B': B_init,
'C': C_init,
'D': D_init,
'E': E_init
}
def fit_curve(x_data, y_data, method, init_params, verbose=False):
"""Execute and evaluate curve fitting"""
try:
if method == '4':
bounds = ([0, 0.5, 0, 0], [np.inf, 10, np.inf, np.inf])
p0 = [init_params['A'], init_params['B'], init_params['C'], init_params['D']]
popt, pcov = curve_fit(four_pl, x_data, y_data, p0=p0, bounds=bounds, maxfev=50000)
y_fit = four_pl(x_data, *popt)
n_params = 4
else:
bounds = ([0, 0.5, 0, 0, 0.5], [np.inf, 10, np.inf, np.inf, 5])
p0 = [init_params['A'], init_params['B'], init_params['C'], init_params['D'], init_params['E']]
popt, pcov = curve_fit(five_pl, x_data, y_data, p0=p0, bounds=bounds, maxfev=50000)
y_fit = five_pl(x_data, *popt)
n_params = 5
metrics = calculate_fit_metrics(y_data, y_fit, n_params)
if verbose:
print("\nFitting Results:")
print(f" R² = {metrics['R2']:.4f}")
print(f" Adjusted R² = {metrics['Adjusted_R2']:.4f}")
print(f" RMSE = {metrics['RMSE']:.4e}")
if metrics['R2'] < 0.99:
print(" Warning: R² is below 0.99. Please check fitting quality.")
return popt, pcov, metrics, y_fit
except RuntimeError as e:
raise RuntimeError(f"Fitting failed: {str(e)}")
def process_data_and_calculate_titer(file_path, sheet_name, output_path, cutoff, method, replicates=2, verbose=False, log_path=None, encoding='utf-8'):
"""
Process ELISA data and calculate titers
Parameters:
-----------
file_path : str
Path to input file (Excel or CSV)
sheet_name : str
Sheet name for Excel files
output_path : str
Path to output Excel file
cutoff : float
Cutoff value
method : str
Fitting method ('4', '5', 'auto')
replicates : int
Number of technical replicates (1: single, 2: duplicate)
verbose : bool
Whether to display detailed output
log_path : str, optional
Path to log file
encoding : str
Encoding for CSV files (default: utf-8)
"""
# Open log file
log_file = open(log_path, 'w', encoding='utf-8') if log_path and verbose else None
def log_print(*args, **kwargs):
if verbose:
print(*args, **kwargs)
if log_file:
output = ' '.join(str(arg) for arg in args)
if 'end' in kwargs:
output += kwargs['end']
else:
output += '\n'
log_file.write(output)
log_file.flush()
try:
if verbose:
log_print(f"Processing started: {file_path}")
log_print(f"File format: {Path(file_path).suffix.lower()}")
log_print(f"Method: {method}PL fitting")
log_print(f"Cutoff value: {cutoff}")
log_print(f"Number of technical replicates: {replicates}")
# Load data
df = load_data(file_path, sheet_name, encoding)
# Create output Excel file
output_wb = openpyxl.Workbook()
results_sheet = output_wb.active
results_sheet.title = "Results"
plots_sheet = output_wb.create_sheet("Plots")
if verbose:
log_print("\nData loading details:")
log_print(f"Total rows: {len(df)}")
log_print("First few rows:")
log_print(df.head())
# Get dilution rates from first row
dilution_rates = df.iloc[0, 1:13].values
if verbose:
log_print(f"\nFound dilution rates: {dilution_rates}")
evaluated_rates = evaluate_dilution_rates(dilution_rates)
if evaluated_rates is None:
raise ValueError("Dilution rate data contains invalid values.")
dilution_rates = np.array(evaluated_rates, dtype=float)
if verbose:
log_print(f"Evaluated dilution rates: {dilution_rates}")
# Sample data starts from third row
sample_names = df.iloc[2:, 0].values
df_data = df.iloc[2:, 1:13]
# Detect data blocks (based on number of replicates)
blocks = []
row = 0
while row < len(df_data):
try:
row_data = pd.to_numeric(df_data.iloc[row], errors='coerce')
if not row_data.isna().all() and row + (8 * replicates // 2) < len(df_data):
blocks.append((row, row + (8 * replicates // 2) - 1))
row += 8 * replicates // 2
else:
row += 1
except Exception as e:
if verbose:
log_print(f"Error while processing row {row}: {str(e)}")
row += 1
if verbose:
log_print(f"\nDetected data blocks:")
for i, (start, end) in enumerate(blocks):
log_print(f"Block {i+1}: rows {start+1} to {end+1}")
if not blocks:
raise ValueError("No valid data blocks found.")
results_df = pd.DataFrame(columns=[
'Sample', 'Titer', 'R2', 'Adjusted_R2', 'RMSE', 'Fitting_Method'
])
for block_idx, (start_row, end_row) in enumerate(blocks):
if verbose:
log_print(f"\nStarting processing of block {block_idx+1}:")
log_print(f"Row range: {start_row+1} to {end_row+1}")
block_data = df_data.iloc[start_row:end_row+1]
# Adjust data processing based on number of replicates
for sample_idx in range(0, end_row - start_row + 1, replicates):
try:
# Get replicate data
replicate_data = block_data.iloc[sample_idx:sample_idx+replicates]
replicate_numeric = replicate_data.apply(pd.to_numeric, errors='coerce')
y_data = replicate_numeric.mean().values
if verbose:
log_print(f"\n Processing sample {sample_idx//replicates + 1}:")
log_print(f" Data: {y_data}")
if np.isnan(y_data).any():
log_print(f"Warning: Sample {sample_idx//replicates + 1} contains invalid data")
continue
sample_name = sample_names[start_row + sample_idx]
if verbose:
log_print(f"Processing sample: {sample_name}")
process_rows = [start_row + sample_idx + i + 1 for i in range(replicates)]
log_print(f"Using data: average of rows {', '.join(map(str, process_rows))}")
init_params = get_initial_params(y_data, dilution_rates)
try:
if method == '4':
popt, pcov, metrics, y_fit = fit_curve(
dilution_rates, y_data, '4', init_params, verbose
)
final_method = '4'
elif method == '5':
popt, pcov, metrics, y_fit = fit_curve(
dilution_rates, y_data, '5', init_params, verbose
)
final_method = '5'
else:
metrics_4pl = None
metrics_5pl = None
try:
popt_4pl, _, metrics_4pl, y_fit_4pl = fit_curve(
dilution_rates, y_data, '4', init_params, verbose
)
except RuntimeError:
if verbose:
log_print("4PL fitting failed")
try:
popt_5pl, _, metrics_5pl, y_fit_5pl = fit_curve(
dilution_rates, y_data, '5', init_params, verbose
)
except RuntimeError:
if verbose:
log_print("5PL fitting failed")
if metrics_4pl and metrics_5pl:
if metrics_4pl['AIC'] < metrics_5pl['AIC']:
popt, metrics, y_fit = popt_4pl, metrics_4pl, y_fit_4pl
final_method = '4'
else:
popt, metrics, y_fit = popt_5pl, metrics_5pl, y_fit_5pl
final_method = '5'
elif metrics_4pl:
popt, metrics, y_fit = popt_4pl, metrics_4pl, y_fit_4pl
final_method = '4'
elif metrics_5pl:
popt, metrics, y_fit = popt_5pl, metrics_5pl, y_fit_5pl
final_method = '5'
else:
raise RuntimeError("Both fitting methods failed")
titer = np.interp(cutoff, y_fit[::-1], dilution_rates[::-1])
new_row = pd.DataFrame([{
'Sample': sample_name,
'Titer': titer,
'R2': metrics['R2'],
'Adjusted_R2': metrics['Adjusted_R2'],
'RMSE': metrics['RMSE'],
'Fitting_Method': f'{final_method}PL'
}])
results_df = pd.concat([results_df, new_row], ignore_index=True)
# Set the appropriate font before plotting
jp_font = set_japanese_font()
# Plot using the same sample name
replicate_numeric = replicate_data.apply(pd.to_numeric, errors='coerce')
y_data = replicate_numeric.mean().values
y_errors = replicate_numeric.sem().values if replicates > 1 else np.zeros_like(y_data)
plt.figure(figsize=(10, 6))
plt.errorbar(dilution_rates, y_data,
yerr=y_errors,
fmt='o', label='Measured values',
capsize=5)
plt.semilogx(dilution_rates, y_fit, '-', label='Fitting curve')
plt.axhline(y=cutoff, color='r', linestyle='--', label='Cutoff')
plt.axvline(x=titer, color='g', linestyle='--', label='Antibody titer')
plt.xlabel('Dilution rate')
plt.ylabel('Absorbance')
plt.title(f'{sample_name} ({final_method}PL fitting)')
plt.legend()
plt.grid(True)
# Save plot to memory
img_buffer = io.BytesIO()
plt.savefig(img_buffer, format='png', dpi=300)
# Save as individual PNG file
plot_dir = Path(output_path).parent / 'plots'
if not os.path.exists(plot_dir):
os.makedirs(plot_dir)
plot_path = plot_dir / f'{sample_name}_plot.png'
plt.savefig(plot_path, dpi=300, bbox_inches='tight')
plt.close()
# Place plot in Excel
img = Image(img_buffer)
img.width = 600
img.height = 400
plots_sheet.cell(row=row_position-1, column=1, value=sample_name)
plots_sheet.add_image(img, f'A{row_position}')
if verbose:
log_print(f"Plot placement: Sample {sample_name} placed at row {row_position}")
except Exception as e:
log_print(f"Warning: Error during fitting for {sample_name}: {str(e)}")
except Exception as e:
log_print(f"Warning: Error processing block {block_idx+1}, pair {pair_idx//2+1}: {str(e)}")
# Write results to Results sheet
for i, col in enumerate(results_df.columns):
results_sheet.cell(row=1, column=i+1, value=col)
for i, row in results_df.iterrows():
for j, value in enumerate(row):
results_sheet.cell(row=i+2, column=j+1, value=value)
# Adjust column widths
for column in results_sheet.columns:
max_length = 0
column = [cell for cell in column]
for cell in column:
try:
if len(str(cell.value)) > max_length:
max_length = len(str(cell.value))
except:
pass
adjusted_width = (max_length + 2)
results_sheet.column_dimensions[column[0].column_letter].width = adjusted_width
# Save workbook and return results
output_wb.save(output_path)
return len(results_df)
except Exception as e:
raise Exception(f"Error occurred during processing: {str(e)}")
finally:
if log_file:
log_file.close()
def parse_args():
parser = argparse.ArgumentParser(
description='ELISA Analysis Tool - Optimized Version',
formatter_class=argparse.RawDescriptionHelpFormatter,
epilog="""
Input file formats:
- Excel (.xlsx, .xls)
- CSV (.csv)
Note:
- Both formats require dilution rates in row 1 and data from row 3 onwards
- CSV files must have at least 13 columns (sample name + 12 data points)
- Output is always in Excel (.xlsx) format"""
)
parser.add_argument('--input', '-i', required=True,
help='Input file (Excel or CSV)')
parser.add_argument('--cutoff', '-c', type=float, required=True,
help='Cutoff value')
parser.add_argument('--method', '-m', choices=['4', '5', 'auto'],
default='auto',
help='Fitting method (4: 4PL, 5: 5PL, auto: automatic selection)')
parser.add_argument('--replicates', '-r', type=int, choices=[1, 2],
default=2,
help='Number of technical replicates (1: single, 2: duplicate)')
parser.add_argument('--verbose', '-v', action='store_true',
help='Display detailed output')
parser.add_argument('--encoding', '-e', default='utf-8',
help='CSV file encoding (default: utf-8)')
return parser.parse_args()
def main():
args = parse_args()
try:
input_path = Path(args.input)
# Check input file existence
if not input_path.exists():
print(f"Error: File '{input_path}' not found", file=sys.stderr)
return 1
# Check file format
if input_path.suffix.lower() not in ['.xlsx', '.xls', '.csv']:
print(f"Error: Unsupported file format: {input_path.suffix}", file=sys.stderr)
print("Supported formats: .xlsx, .xls, .csv", file=sys.stderr)
return 1
# Generate output filename (output in xlsx format even for CSV input)
output_path = input_path.parent / f'results_{input_path.stem}.xlsx'
# Set log file path
log_path = None
if args.verbose:
log_path = input_path.parent / f'analysis_log_{input_path.stem}.txt'
# Set sheet name based on file format
sheet_name = 'Sheet1' if input_path.suffix.lower() in ['.xlsx', '.xls'] else None
try:
num_samples = process_data_and_calculate_titer(
args.input,
sheet_name,
output_path,
args.cutoff,
args.method,
args.replicates,
args.verbose,
log_path,
encoding=args.encoding
)
print(f"Processing complete: Analyzed {num_samples} samples")
print(f"Results saved to {output_path}")
if args.verbose:
print(f"Analysis log saved to {log_path}")
except UnicodeDecodeError as e:
print(f"Encoding error: {str(e)}", file=sys.stderr)
print("Please specify appropriate encoding using --encoding option", file=sys.stderr)
print("Example: -e shift-jis or -e cp932", file=sys.stderr)
return 1
except ValueError as e:
print(f"Error: {str(e)}", file=sys.stderr)
return 1
except Exception as e:
print(f"Unexpected error occurred: {str(e)}", file=sys.stderr)
if args.verbose:
import traceback
traceback.print_exc()
return 1
except Exception as e:
print(f"Error occurred: {str(e)}", file=sys.stderr)
if args.verbose:
import traceback
traceback.print_exc()
return 1
return 0
if __name__ == '__main__':
exit(main())Usage example
usage: Endpoint_titer.py [-h] --input INPUT --cutoff CUTOFF [--method {4,5,auto}] [--replicates {1,2}] [--verbose]

Optimized ELISA Analysis Tool

options:
  -h, --help            Display help message and exit
  --input INPUT, -i INPUT
                        Specify input Excel file or csv file
  --cutoff CUTOFF, -c CUTOFF
                        Define cutoff value
  --method {4,5,auto}, -m {4,5,auto}
                        Select fitting method (4: 4PL, 5: 5PL, auto: Automatic selection)
  --replicates {1,2}, -r {1,2}
                        Specify number of technical replicates (1: Single, 2: Duplicate)
  --verbose, -v         Enable detailed output logging


Implementation Examples

Basic Implementation

bashCopypython endpoint_titer.py --input data.xlsx --cutoff 0.5

Specified Fitting Methods

bashCopy# Implementation with 4PL fitting
python endpoint_titer.py --input data.xlsx --cutoff 0.5 --method 4

# Implementation with 5PL fitting
python endpoint_titer.py --input data.xlsx --cutoff 0.5 --method 5

# Implementation with automatic method selection
python endpoint_titer.py --input data.xlsx --cutoff 0.5 --method auto

Enhanced Logging Implementation

bashCopypython elisa_analysis.py --input data.xlsx --cutoff 0.5 --verbose
Conclusion
This automated system significantly streamlines the calculation of antibody titers, reducing what was previously a time-consuming process to a matter of moments. The increased efficiency in data analysis should allow researchers and educators to allocate more time to their core academic and research activities.
It is worth noting that this represents just one of several analytical tools in our developing suite of research scripts. Additional computational resources and analytical tools will be introduced in subsequent communications.