Processing でグラフを描く② 3次関数と導関数
Processing でグラフを描く 第二回は「3次関数」をグラフで描きます。導関数(微分)についても簡単に触れたいと思います。
座標を描く
BACKGROUND_COLOR = color(0, 44, 77)
colors = [
    [255, 255, 255],  # white
    [255, 127, 0],  # orange
    [255, 0, 255],  # magenta
    [127, 127, 255],  # lightblue
    [255, 255, 0],  # yellow
    [0, 255, 0],  # lime
    [255, 127, 127],  # pink
    [127, 127, 127],  # gray
    [191, 191, 191],  # lightgray
    [0, 255, 255],  # cyan
    [127, 0, 127],  # purple
    [0, 0, 255],  # blue
    [127, 0, 0],  # brown
    [0, 127, 0],  # green
    [255, 0, 0],  # red
    [0, 0, 0],  # black
]
SIZE = 1000
STEP = 50
points = []


def setup():
    global points, tex, image_name
    size(SIZE, SIZE)


def draw():
    background(BACKGROUND_COLOR)
    stroke(0, 255, 0, 50)
    for i in range(int(SIZE / STEP)):
        line(-2000, i * STEP, 2000, i * STEP)
        line(i * STEP, -2000, i * STEP, 2000)
    pushMatrix()
    translate(width / 2, height / 2)
    noFill()
    stroke(0, 255, 0)
    line(-2000, 0, 2000, 0)
    line(0, -2000, 0, 2000)
    popMatrix()
まずは直交座標を描きます。画面サイズ(変数SIZE)は1000にしました。グラフの1目盛り(変数STEP)は50に設定しています。グラフで描きたい範囲によって増減させてください。グラフを拡大したいときは STEPをより大きく、縮小したいときは STEPをより小さく設定してください。
3次関数を描く
def setup():
    global points
    size(SIZE, SIZE)
    coefficients = [
        [0.5, -2, -1, 3],
        [1, 0.5, 2, -1],
        [2, 0, -4, 5],
        [-0.5, 0.5, 3, -1],
        [-0.5, -2, -1, 3],
    ]

    # グラフのデータ
    for coefficient in coefficients:
        points.append(
            [cubic_function(i, coefficient) for i in range(int(-width / 2), int(width / 2))]
        )


def draw():
    background(BACKGROUND_COLOR)
    stroke(0, 255, 0, 50)
    for i in range(int(SIZE / STEP)):
        line(-2000, i * STEP, 2000, i * STEP)
        line(i * STEP, -2000, i * STEP, 2000)
    pushMatrix()
    translate(width / 2, height / 2)
    noFill()
    stroke(0, 255, 0)
    line(-2000, 0, 2000, 0)
    line(0, -2000, 0, 2000)
    # X座標の移動を制限
    count = min(frameCount, width - 1)
    # 描画点のx座標
    stroke(255, 50)
    ellipse(count, 0, 5, 5)
    line(count - width / 2, -height / 2, count - width / 2, height / 2)
    # 関数を描く
    for j, p in enumerate(points):
        stroke(colors[j][0], colors[j][1], colors[j][2])
        for i in range(count):
            x1 = i - width / 2
            y1 = p[i] * STEP
            x2 = (i + 1) - width / 2
            y2 = p[i + 1] * STEP
            if abs(y1) < height and abs(y2) < height:
                line(x1, -y1, x2, -y2)


def cubic_function(x, coefficient):
    return coefficient[0] * (float(x) / STEP) ** 3 + \
           coefficient[1] * (float(x) / STEP) ** 2 + \
           coefficient[2] * (float(x) / STEP) + \
           coefficient[3]
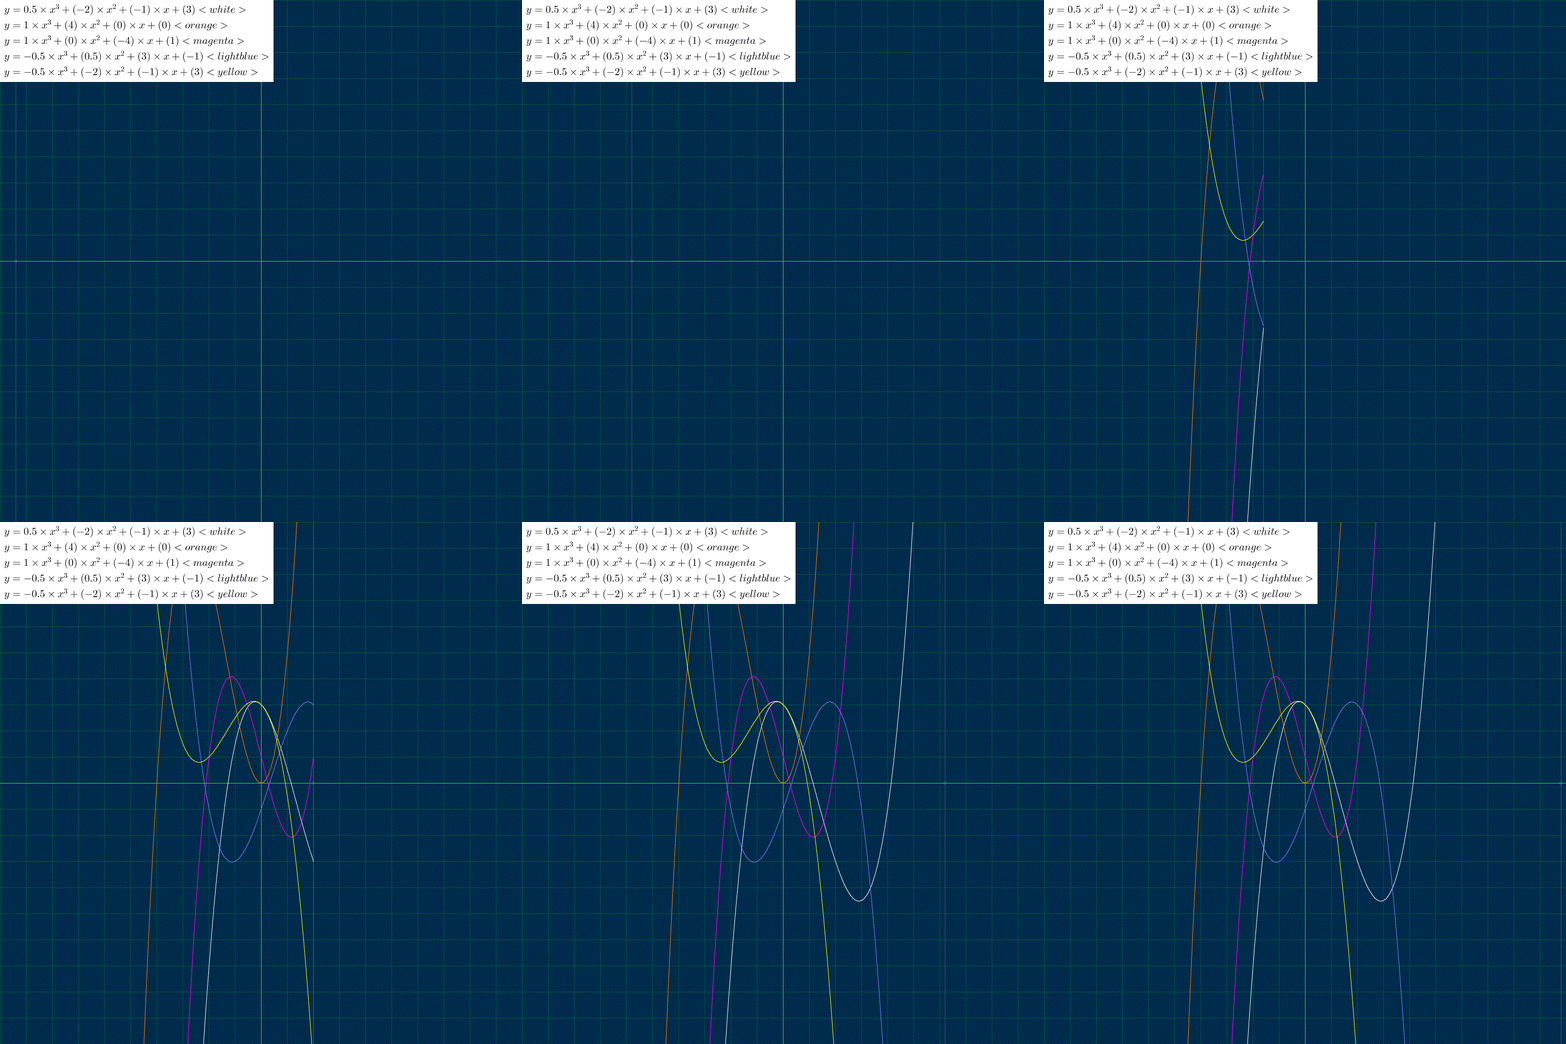
5本の3次関数を描きました。変数coefficients は3次関数の係数を指定します。係数は適当に決めましたが、x軸と1点で交わるものと、2点で交わるものと、3点で交わるものがあることが見て取れます。
$${x^3}$$ の係数を 0 にすると、2次関数、$${x^2}$$ の係数も 0 にすると1次関数を描くことができます。
変数coefficients をいじって、いろいろな関数を描いて遊んでみてください。
導関数を描く
def setup():
    global points
    size(SIZE, SIZE)
    coefficients = [
        [0.5, -2, -1, 3],
        # [1, 4, 0, 0],
        # [1, 0, -4, 1],
        # [-0.5, 0.5, 3, -1],
        # [-0.5, -2, -1, 3],
        [0, 1.5, -4, -1]
    ]

    # グラフのデータ
    for coefficient in coefficients:
        points.append(
            [cubic_function(i, coefficient) for i in range(int(-width / 2), int(width / 2))]
        )


def draw():
    background(BACKGROUND_COLOR)
    stroke(0, 255, 0, 50)
    for i in range(int(SIZE / STEP)):
        line(-2000, i * STEP, 2000, i * STEP)
        line(i * STEP, -2000, i * STEP, 2000)
    pushMatrix()
    translate(width / 2, height / 2)
    noFill()
    stroke(0, 255, 0)
    line(-2000, 0, 2000, 0)
    line(0, -2000, 0, 2000)
    # X座標の移動を制限
    count = min(frameCount, width - 1)
    point_x = count - width / 2
    # 描画点のx座標
    stroke(255, 50)
    ellipse(point_x, 0, 5, 5)
    line(point_x, -height / 2, point_x, height / 2)
    # 関数を描く
    # 元のグラフ
    stroke(colors[0][0], colors[0][1], colors[0][2])
    for i in range(width - 1):
        x1 = i - width / 2
        y1 = points[0][i] * STEP
        x2 = (i + 1) - width / 2
        y2 = points[0][i + 1] * STEP
        if abs(y1) < height and abs(y2) < height:
            line(x1, -y1, x2, -y2)
    # 接点
    contact_x = point_x
    contact_y = points[0][count] * STEP
    slop = points[1][count]
    fill(colors[2][0], colors[2][1], colors[2][2])
    if abs(contact_y) < height:
        ellipse(contact_x, -contact_y, 10, 10)
    # 接線を描く
    stroke(colors[2][0], colors[2][1], colors[2][2])
    if abs(slop) < 100:
        tangent_line(-slop, contact_x, -contact_y)
    else:
        line(contact_x, -height, contact_x, height)
    # 導関数を描く
    stroke(colors[1][0], colors[1][1], colors[1][2])
    for i in range(count - 1):
        x1 = i - width / 2
        y1 = points[1][i] * STEP
        x2 = (i + 1) - width / 2
        y2 = points[1][i + 1] * STEP
        if abs(y1) < height and abs(y2) < height:
            line(x1, -y1, x2, -y2)
    popMatrix()


def cubic_function(x, coefficient):
    return coefficient[0] * (float(x) / STEP) ** 3 + \
           coefficient[1] * (float(x) / STEP) ** 2 + \
           coefficient[2] * (float(x) / STEP) + \
           coefficient[3]


def tangent_graph(n, a, b, c):
    if abs(a) > 1:
        return (n - c) / a + b
    else:
        return a * (n - b) + c


def tangent_line(a, b, c):
    if abs(a) > 1:
        y1 = -width / 2
        x1 = tangent_graph(y1, a, b, c)
        y2 = width / 2
        x2 = tangent_graph(y2, a, b, c)
    else:
        x1 = -width / 2
        y1 = tangent_graph(x1, a, b, c)
        x2 = width / 2
        y2 = tangent_graph(x2, a, b, c)
    line(x1, y1, x2, y2)
次は導関数(微分)を描きます。
導関数の公式は
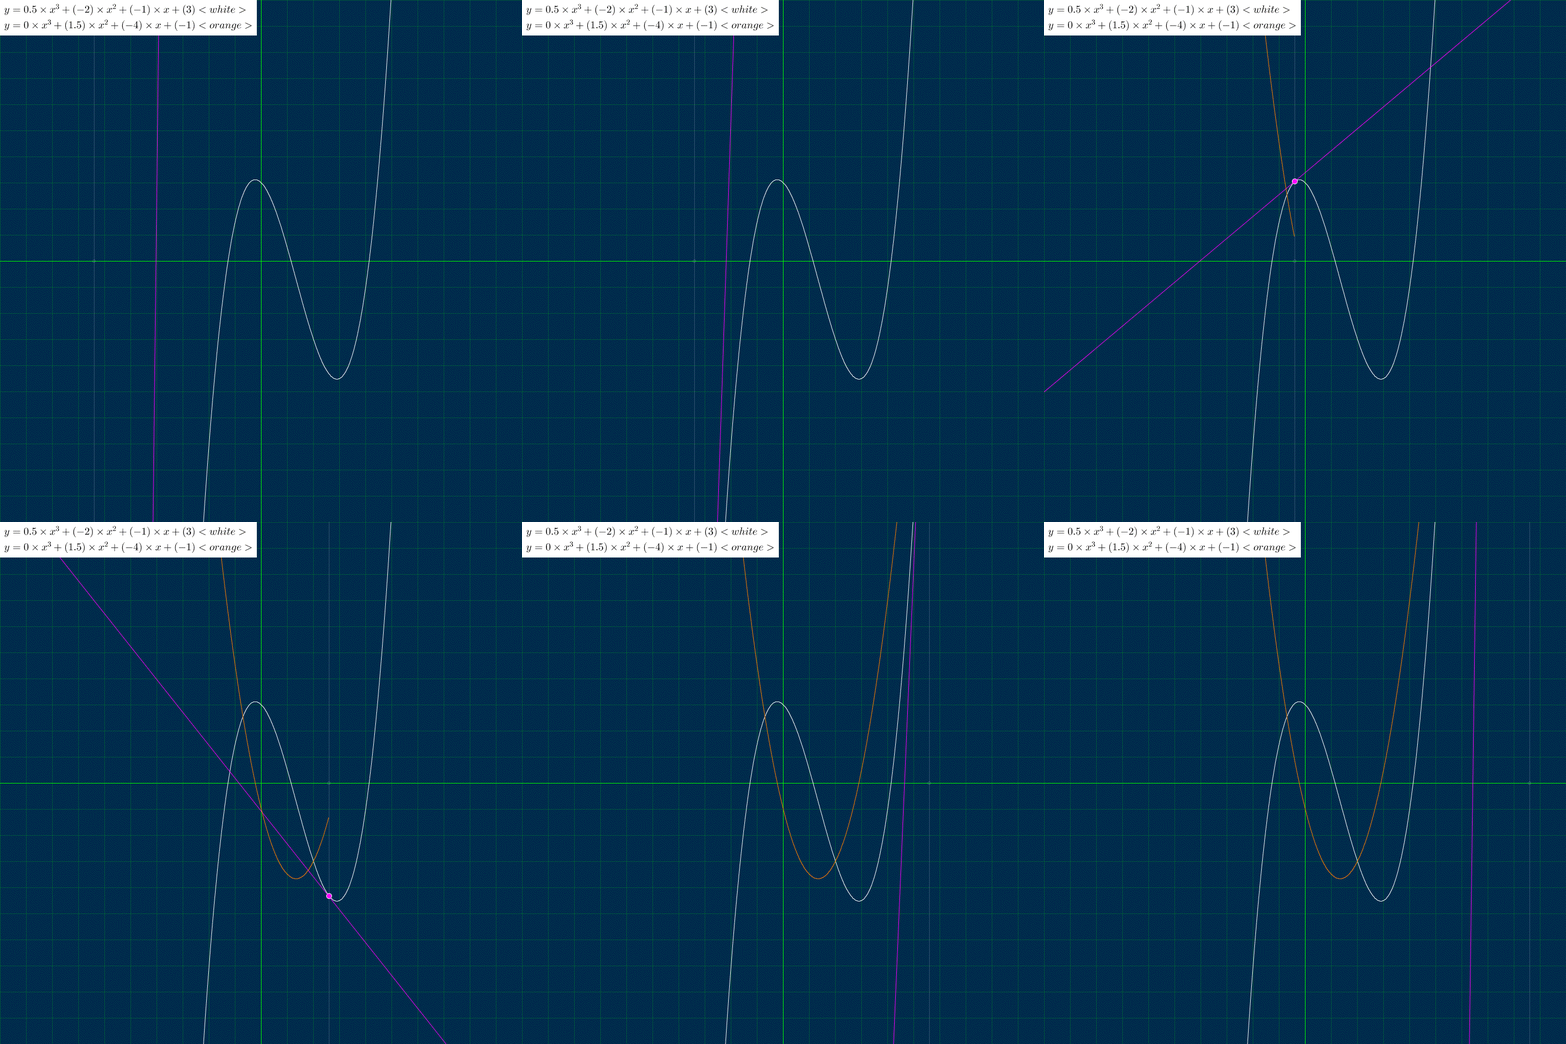
$${(x^n)' = n x^{n - 1}}$$より、元の関数 $${y = 0. 5 x^3 -2 x^2 - x + 3}$$ の導関数(微分)は $${y = 1. 5 x^2 - 4 x - 1}$$ になります。
接点contact_x, contact_y を元の関数に描画点point_x を代入して求めます。
傾きslop は描画点point_xにおける導関数の値です。接線として、点(contact_x, cpntact_y)を通る傾きslop の線を描きます。
よく見ていただくと、3次関数(元の関数)の2つの山の頂点で、傾きが 0 になり、導関数の値も 0 になっていることが確認できます。
導関数の理解
BACKGROUND_COLOR = color(0, 44, 77)
colors = [
    [255, 255, 255],  # white
    [255, 127, 0],  # orange
    [255, 0, 255],  # magenta
    [127, 127, 255],  # lightblue
    [255, 255, 0],  # yellow
    [0, 255, 0],  # lime
    [255, 127, 127],  # pink
    [127, 127, 127],  # gray
    [191, 191, 191],  # lightgray
    [0, 255, 255],  # cyan
    [127, 0, 127],  # purple
    [0, 0, 255],  # blue
    [127, 0, 0],  # brown
    [0, 127, 0],  # green
    [255, 0, 0],  # red
    [0, 0, 0],  # black
]
SIZE = 1000
STEP = 100
points = []


def setup():
    global points
    size(SIZE, SIZE)
    coefficients = [
        [0, 1, 0.5, -1],
        # [1, 4, 0, 0],
        # [1, 0, -4, 1],
        # [-0.5, 0.5, 3, -1],
        # [-0.5, -2, -1, 3],
        [0, 0, 2, 0.5],
    ]

    # グラフのデータ
    for coefficient in coefficients:
        points.append(
            [cubic_function(i, coefficient) for i in range(int(-width / 2), int(width / 2))]
        )


def draw():
    background(BACKGROUND_COLOR)
    stroke(0, 255, 0, 50)
    for i in range(int(SIZE / STEP)):
        line(-2000, i * STEP, 2000, i * STEP)
        line(i * STEP, -2000, i * STEP, 2000)
    pushMatrix()
    translate(width / 2, height / 2)
    noFill()
    stroke(0, 255, 0)
    line(-2000, 0, 2000, 0)
    line(0, -2000, 0, 2000)
    # 接点のX座標
    point_x = 1 * STEP
    # 関数を描く
    # 元のグラフ
    stroke(colors[0][0], colors[0][1], colors[0][2])
    for i in range(width - 1):
        x1 = i - width / 2
        y1 = points[0][i] * STEP
        x2 = (i + 1) - width / 2
        y2 = points[0][i + 1] * STEP
        if abs(y1) < height and abs(y2) < height:
            line(x1, -y1, x2, -y2)
    # 接点
    contact_x = point_x
    contact_y = points[0][contact_x + width / 2] * STEP
    slop = points[1][contact_x + width / 2]
    fill(colors[2][0], colors[2][1], colors[2][2])
    if abs(contact_y) < height:
        ellipse(contact_x, -contact_y, 10, 10)
    # 2点を通る直線
    count = STEP - frameCount
    if count > 1:
        stroke(colors[1][0], colors[1][1], colors[1][2])
        _contact_x = point_x + count
        _contact_y = points[0][_contact_x + width / 2] * STEP
        line_between_two_points(
            contact_x,
            contact_y,
            _contact_x,
            _contact_y
        )
        stroke(colors[3][0], colors[3][1], colors[3][2])
        _contact_x = point_x - count
        _contact_y = points[0][_contact_x + width / 2] * STEP
        line_between_two_points(
            contact_x,
            contact_y,
            _contact_x,
            _contact_y
        )
    # 接線を描く
    stroke(colors[2][0], colors[2][1], colors[2][2])
    if abs(slop) < 100:
        tangent_line(-slop, contact_x, -contact_y)
    else:
        line(contact_x, -height, contact_x, height)
    popMatrix()
ある点における接線の求め方をアニメーションで表現しました。
導関数を理解するために、微分係数の定義を示します。
微分係数の定義
関数$${y=f(x)}$$ の $${x=a}$$ における微分係数は
$$
f'(a)= \lim\limits_{h \to 0}\frac{f(a+h) – f(a)}{h}
$$
図(contact line)を見ると、+x側から近づいても(オレンジ)、-x側から近づいても(ライトブルー)同じ接線が求められることが確認できます。求められた接線の傾き(変化率)のことを微分係数と呼んでいます。
そして、導関数の定義は次のようになります。
導関数の定義
関数 $${y=f(x)}$$ において、x の各値 a に微分係数 $${f'(a)}$$ を対応させて得られる関数を $${y=f(x)}$$ の導関数といい、$${f'(x)}$$ で表します。
つまり図(contact line)で求めた傾きを、すべてのxに対して求めて関数にしたものが導関数ということです。微分は実生活ではあまり出てきませんので実感することが難しい概念ですが、この記事がその理解のきっかけになるとうれしく思います。
前の記事
Processing でグラフを描く① sin cos tan
次の記事
Processing でグラフを描く③ 円と楕円
その他のタイトルはこちら
