
How far Mermaid brings us with the complicated architectural diagrams

Hello, I'm Yuta and SRE at Beatrust. I'm in charge of the overall architecture. Today, I'm going to share my learnings when I tried to write a complicated architectural diagram with Mermaid.
Writing and maintaining complicated architectural diagrams
It's always difficult to write and maintain complicated architectural diagrams. During my career, I've been writing many diagrams with many different tools, e.g. physical papers, Microsoft PowerPoint, Google Slides, Cacoo, diagrams.net (previously draw.io), and so on. Of course, I tried to use an approach to generate diagrams from Terraform code. But none of all ways is perfect. Some methods are easy to write the initial version but hard to continue updating according to the architecture improvements. Others are easy to generate but look not enough to explain the important points in the diagram.
I'm usually using Mermaid to write simple diagrams in READMEs. One day, I realized they announced a new feature "architecture-beta". Since the example diagram is quite simple, I wanted to try it with a complicated diagram and whether it's possible to use it as another tool to write and maintain the diagrams.
Here is our overall architecture written by architecture-beta in Mermaid.
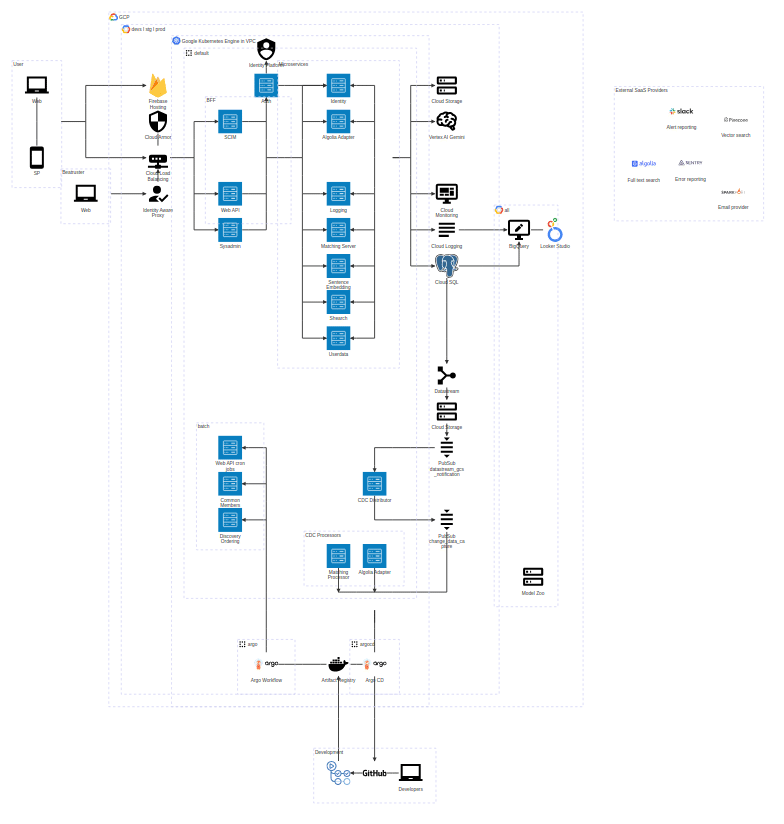
I think it's good enough to use for internal purposes, isn't it!? While it might look ugly to show stakeholders, the appearance should be improved as many features have been added recently to "flowchart" in Mermaid.
Small Tips for writing a beautiful diagram
I noticed some small Tips to write a beautiful diagram with architecture-beta.
Use Junctions
Mermaid provides a feature "Junctions" which is a virtual component acting as a potential 4-way split between edges. I used a lot of Junctions in the above diagram.
Using Junctions makes the diagram look good. Although it might be a limitation of the beta version, it's actually sometimes impossible without Junctions to put each component in a place that I want. A typical example of using Junctions is the following.

The code for the left side is:
lb:R --> L:scim
lb:R --> L:webapi
lb:R --> L:sysadmin
In order to improve the style, I can add Junctions as follows. I realized it would be a good idea to imagine a grid and put Junctions as a virtual dot to the grid to put each component in a place that I want. I can control the place of each component by putting Junctions 4-ways around the components in a logical way.
junction j_lb_r
lb:R -- L:j_lb_r
junction j_scim_l
j_lb_r:T -- B:j_scim_l
j_scim_l:R --> L:scim
junction j_webapi_l
j_lb_r:B -- T:j_webapi_l
j_webapi_l:R --> L:webapi
junction j_sysadmin_l
j_webapi_l:B -- T:j_sysadmin_l
j_sysadmin_l:R --> L:sysadmin
Use Edges out of Groups
Mermaid supports a feature "Edges out of Groups" which creates an edge going out of the group. I used it to determine the place for the component which isn't linked to any other components in theory.
For example, I used this way for Argo CD located at the right bottom. This component isn't linked to any component or more specifically, it's linked to GKE but it's hard to express it in Mermaid. I added a new Junction and used "Edges out of Groups" linking to the component that I want to put Argo CD right below. In this way, I can put Argo CD without creating a direct edge to any other components.
junction j_acd_t
j_algolia_proc_b{group}:B -- T:j_acd_t
j_acd_t:B -- T:acd
Using this feature is still acceptable but isn't a perfect solution. I hope "An invisible link" in flowchart will be supported in architecture-beta as well.
Generate the diagram with mermaid-cli
Since GitHub hasn't supported Iconify icons yet, the diagram is displayed with many "?" marks.

I used Markdown Preview Mermaid Support in VSCode to write the diagram but it's definitely better to show the rendered icons in GitHub as well. In order to solve the issue, I used mermaid-cli to generate Markdown file in which the Mermaid diagrams are replaced by generated SVG files and implemented a new GitHub Actions workflow to call the command to generate the Markdown automatically.
{
  "name": "architecture",
  "scripts": {
    "build": "mmdc -i template.md -p puppeteer-config.json --iconPacks @iconify-json/logos @iconify-json/mdi -o ../architecture.md"
  },
  "dependencies": {
    "@mermaid-js/mermaid-cli": "https://github.com/mermaid-js/mermaid-cli.git",
    "puppeteer": "^24.1.1"
  }
}
Note that the PR that I created to support Iconify icons was merged but hasn't been released yet.
Take away
"architecture-beta" in Mermaid is practical enough even for complicated architectural diagrams although some small Tips are required for writing a beautiful diagram. It sometimes looks ugly for now but I hope many useful features will be implemented and become a better tool.
This is just an only one trial of architecture-beta and we must review for a while with our team whether it's easier to maintain with Mermaid than other tools or vice versa. I hope this way will solve the challenge that I've faced for a long time.