ggplot2: ボックスプロットを並び替える
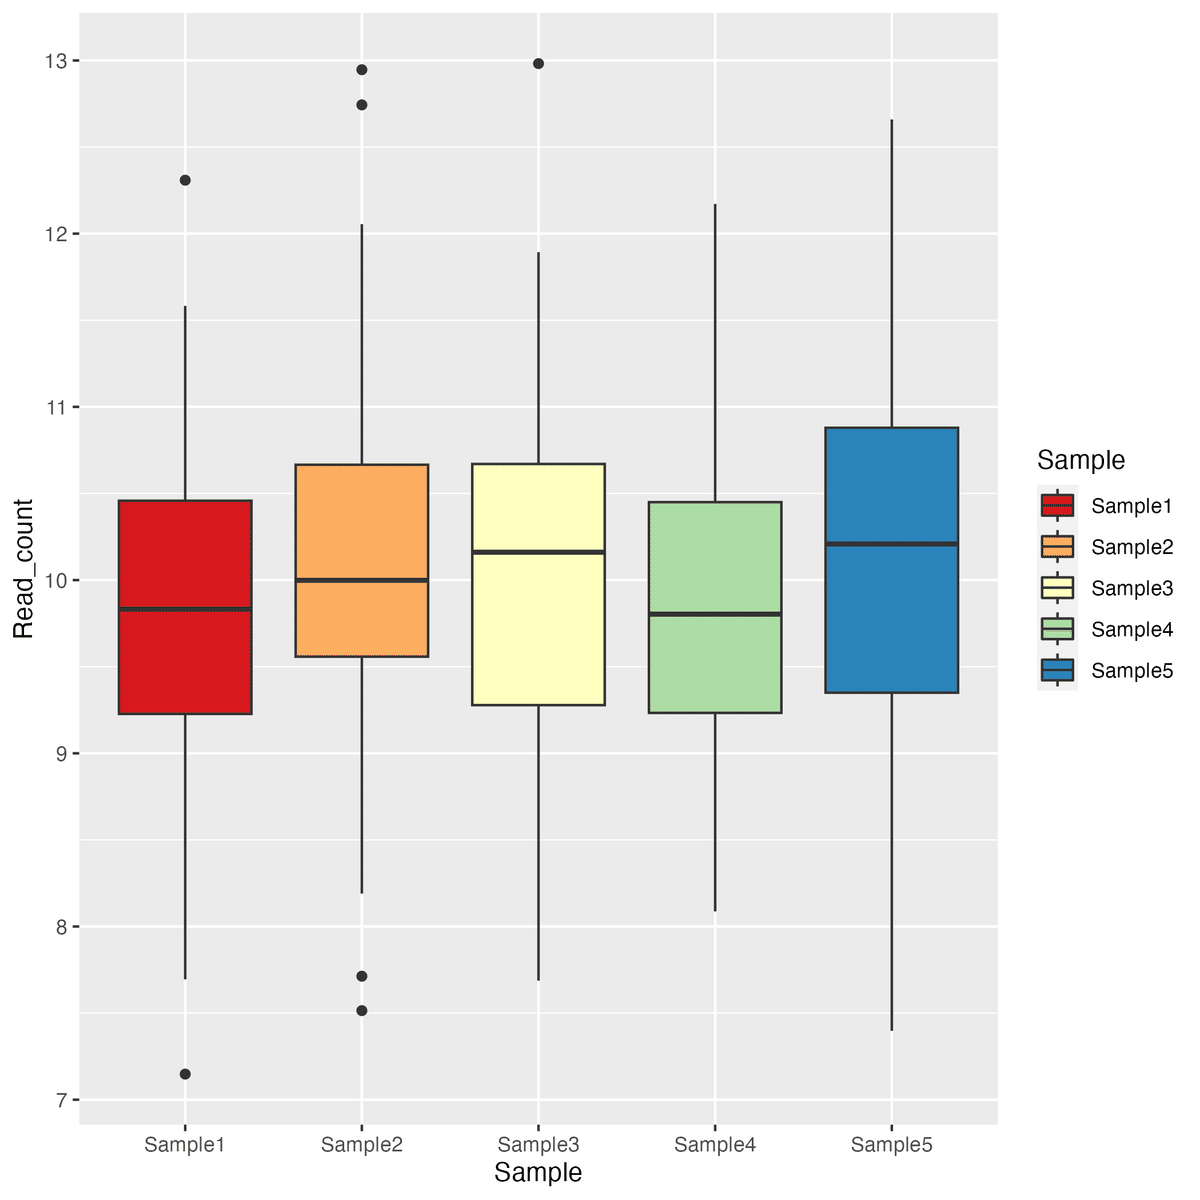
ggplot2 でボックスプロットを作成するとき、X軸のデータの並び方(例では Sample) は、自動的に決められています。内部では、aes() の x に指定した列の値を factor 型のデータとして扱い、アルファベット順に並べて表示されます。
指定しない場合のボックスプロット
下記の例の場合、文字列として、Sample1, Sample2, Sample3, … となっているのは、番号の若い順に並べられたためです。もとの input_data の列の並びが反映されたわけではありません。この並びを直接指定するには、少しコツが入ります。

> input_data
# A tibble: 100 × 5
   Sample1 Sample2 Sample3 Sample4 Sample5
     <dbl>   <dbl>   <dbl>   <dbl>   <dbl>
 1   11.1    10.3     8.03    8.39   11.1
 2    9.80   10.9    10.4     9.78    8.98
 3    9.22   11.8     8.45    9.85   10.3
 4   10.2    10.3    13.0     9.28    9.30
 5   10.8    10.9    11.3    11.0    11.0
 6    9.54    9.46   10.4    11.8    10.6
 7   10.4     9.64    8.52    8.44    8.68
 8   11.0    11.2    10.6     9.31    9.96
 9   10.7    10.2     9.27   12.0     9.28
10   10.4    11.1    10.7     9.90   11.5
# … with 90 more rows
# ℹ Use `print(n = ...)` to see more rows
input_data を gather で整形してから ggplot() 関数に渡すため、この状態の並びは影響しません。(これを並び替えても結果は変わりません。)
factor() に levels を指定して並び替え
X軸のデータ(例ではサンプル)の並びを任意に指定したい場合は、 gather() で整形した際に、サンプルを factor() 型のデータに変換します。そのとき、factor() の引数に levels として、並びを指定する文字列を渡します。
ボックスプロット用に整形したデータ
冒頭のボックスプロットを作成するために整形したデータ (plot_data) は、下記のようになっています。
> plot_data <- input_data %>%
+   gather(starts_with("Sample"), key = "Sample", value = "Read_count")

>
> plot_data
# A tibble: 500 × 2
   Sample  Read_count
   <chr>        <dbl>
 1 Sample1      11.1
 2 Sample1       9.80
 3 Sample1       9.22
 4 Sample1      10.2
 5 Sample1      10.8
 6 Sample1       9.54
 7 Sample1      10.4
 8 Sample1      11.0
 9 Sample1      10.7
10 Sample1      10.4
# … with 490 more rows
# ℹ Use `print(n = ...)` to see more rows
この plot_data は、2列のテーブルです。1列目は、X軸に指定する予定のデータで、Sample1 が 100個、 Sample2 が100個、、、と続く500行のデータです。この状態では、Sample 列の型は、character型なので、「<chr>」と表示されています。
factor 型に変換して levels を指定
この character 型の Sample を factor 型に変換するには、 mutate を使います。mutate("Sample" = factor(Sample)) とすると変換できます。その際、引数の levels に希望の順序に並んだ文字列を指定します。ここでは、サンプルの順序を指定した文字列として、下記のような sample_order を定義して使用しました。
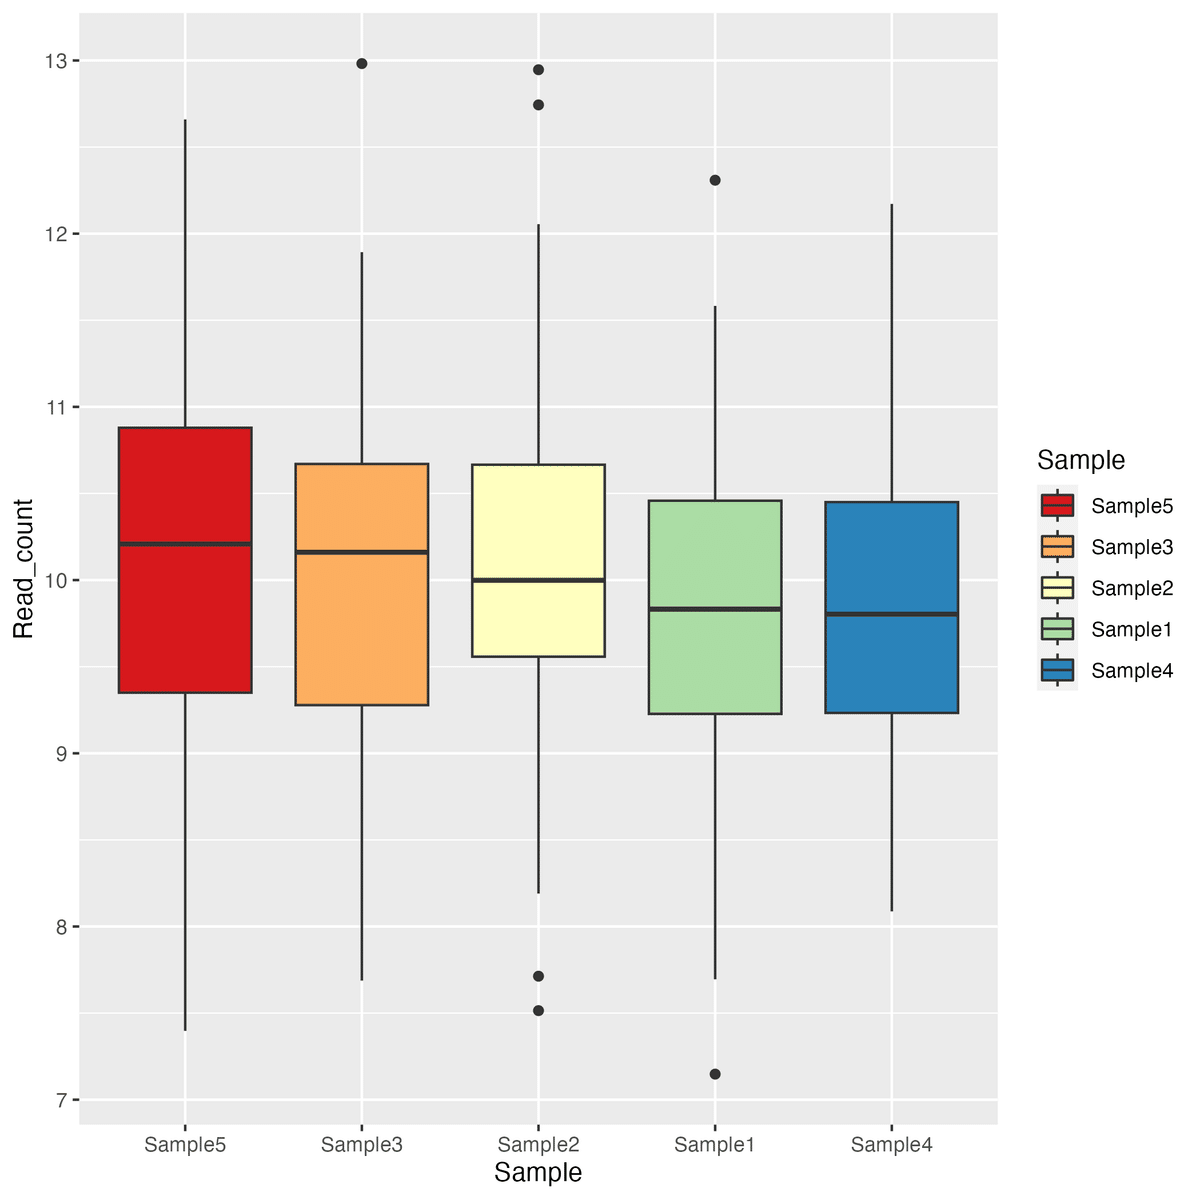
sample_order <- c("Sample5", "Sample3", "Sample2", "Sample1", "Sample4")

plot_data <- input_data %>%
  gather(starts_with("Sample"), key = "Sample", value = "Read_count") %>%
  mutate("Sample" = factor(Sample, levels = sample_order))
plot_data と入力して、中身を確認すると、下記のように <chr> から <fct> に変わっていることが分かります。
> plot_data
# A tibble: 500 × 2
   Sample  Read_count
   <fct>        <dbl>
 1 Sample1      11.1
 2 Sample1       9.80
 3 Sample1       9.22
 4 Sample1      10.2
 5 Sample1      10.8
 6 Sample1       9.54
 7 Sample1      10.4
 8 Sample1      11.0
 9 Sample1      10.7
10 Sample1      10.4
# … with 490 more rows
# ℹ Use `print(n = ...)` to see more rows
この plot_data を使用して、ボックスプロットを作成します。ボックスプロット部分のコードに変更はありません。
ggplot(plot_data, aes(x = Sample, y = Read_count, fill = Sample)) +
  geom_boxplot() + scale_fill_brewer(palette = "Spectral")
並び替えられたボックスプロットが表示されます。今回、指定した文字列 sample_order は、中央値の高い順に並べた時のサンプルの順序です。

