
TradingViewを使い倒す―たくさんインジゲーターを表示したいけど課金したくない方へ―

お金に縛られない人生を模索中の旭です。今回は、TradingViewを課金せずに使い倒す方法を紹介します。
TradingViewのインジケーター表示上限
TradingViewを利用されている方ならば、単純にローソク足だけでなくて移動平均線などの様々なインジケーターを表示させていると思います。ただ、TradingView無課金ユーザーはインジケーターを2つまでしか表示できません。これでは満足のいくトレード研究はできませんよね。
TradingViewの有料ユーザーになるのもいいですが、PineScriptを使えば無課金でもインジケーターを複数表示できますよ。この記事ではPineScriptの簡単な使い方を紹介します。
PineScriptとは?
PineScriptとはTradingViewでオリジナルのインジケーターを作るための特殊なプログラミング言語です。無料ユーザーでも使用できます。
プログラミングに自信がないな・・・という方はココナラでTradingViewのインジゲータの受託製作を行っていますのでよろしければご依頼ください。
複数のインジゲーターを集約する方法
ここでは例として移動平均線とボリンジャーバンドを表示するPineScriptを作成してみます。chatGPTを使用するので、chatGPTのアカウントを持っていない方はアカウントを作成しておいてください。
手順① とりあえずTradingView標準のインジゲーターを選択
画面上部のインジゲーターからSMA(単純移動平均)を選び、インジゲーターを表示させましょう。

手順② TradingView公式のPineScriptを確認
インジケータ名にカーソルを合わせたときに表示させる{}マークを押します。

すると画面下部にソースコードが表示されるはずです。本記事執筆時点ではこのように表示されました。
//@version=6
indicator(title="Moving Average Simple", shorttitle="SMA", overlay=true, timeframe="", timeframe_gaps=true)
len = input.int(9, minval=1, title="Length")
src = input(close, title="Source")
offset = input.int(title="Offset", defval=0, minval=-500, maxval=500, display = display.data_window)
out = ta.sma(src, len)
plot(out, color=color.blue, title="MA", offset=offset)

// Smoothing MA inputs
GRP = "Moving Average"
TT_BB = "Only applies when 'SMA + Bollinger Bands' is selected. Determines the distance between the SMA and the bands."
maTypeInput = input.string("None", "Type", options = ["None", "SMA", "SMA + Bollinger Bands", "EMA", "SMMA (RMA)", "WMA", "VWMA"], group = GRP, display = display.data_window)
maLengthInput = input.int(14, "Length", group = GRP, display = display.data_window)
bbMultInput = input.float(2.0, "BB StdDev", minval = 0.001, maxval = 50, step = 0.5, tooltip = TT_BB, group = GRP, display = display.data_window)
var enableMA = maTypeInput != "None"
var isBB = maTypeInput == "SMA + Bollinger Bands"

// Smoothing MA Calculation
ma(source, length, MAtype) =>
	switch MAtype
		"SMA"                   => ta.sma(source, length)
		"SMA + Bollinger Bands" => ta.sma(source, length)
		"EMA"                   => ta.ema(source, length)
		"SMMA (RMA)"            => ta.rma(source, length)
		"WMA"                   => ta.wma(source, length)
		"VWMA"                  => ta.vwma(source, length)

// Smoothing MA plots
smoothingMA = enableMA ? ma(out, maLengthInput, maTypeInput) : na
smoothingStDev = isBB ? ta.stdev(out, maLengthInput) * bbMultInput : na
plot(smoothingMA, "SMA-based MA", color=color.yellow, display = enableMA ? display.all : display.none)
bbUpperBand = plot(smoothingMA + smoothingStDev, title = "Upper Bollinger Band", color=color.green, display = isBB ? display.all : display.none)
bbLowerBand = plot(smoothingMA - smoothingStDev, title = "Lower Bollinger Band", color=color.green, display = isBB ? display.all : display.none)
fill(bbUpperBand, bbLowerBand, color= isBB ? color.new(color.green, 90) : na, title="Bollinger Bands Background Fill", display = isBB ? display.all : display.none)
実はTradingView標準のインジケータもPineScriptで動いています。ご丁寧にもTradingView開発チームの信頼性の高い公式コードを確認できるわけです。表示されたコードを解析して改造すればオリジナルのインジケータを作れます。
同じくボリンジャーバンドのPineScriptを確認すると以下のように記述されていました。
//@version=6
indicator(shorttitle="BB", title="Bollinger Bands", overlay=true, timeframe="", timeframe_gaps=true)
length = input.int(20, minval=1)
maType = input.string("SMA", "Basis MA Type", options = ["SMA", "EMA", "SMMA (RMA)", "WMA", "VWMA"])
src = input(close, title="Source")
mult = input.float(2.0, minval=0.001, maxval=50, title="StdDev")

ma(source, length, _type) =>
    switch _type
        "SMA" => ta.sma(source, length)
        "EMA" => ta.ema(source, length)
        "SMMA (RMA)" => ta.rma(source, length)
        "WMA" => ta.wma(source, length)
        "VWMA" => ta.vwma(source, length)

basis = ma(src, length, maType)
dev = mult * ta.stdev(src, length)
upper = basis + dev
lower = basis - dev
offset = input.int(0, "Offset", minval = -500, maxval = 500, display = display.data_window)
plot(basis, "Basis", color=#2962FF, offset = offset)
p1 = plot(upper, "Upper", color=#F23645, offset = offset)
p2 = plot(lower, "Lower", color=#089981, offset = offset)
fill(p1, p2, title = "Background", color=color.rgb(33, 150, 243, 95))
手順③ オリジナルのPineScriptを作る!
プログラミングの知識がなくても大丈夫です。従来であればTradingView公式コードを参考にしながら、オリジナルインジゲーターのコードを手作業で作る必要があったのですが、我々にはAIという強い味方がいます。chatGPTに以下のように指示を出してください(所定の箇所に表示させたPineScriptを貼り付けてください)。
あなたはTradingViewのPineScriptに精通したエンジニアです。移動平均線とボリンジャーバンドの両方を同時に表示するオリジナルインジケータを生成してください。
移動平均線のPineScriptは以下の通りです。
###ここに移動平均線のPineScriptを貼り付ける###
ボリンジャーバンドのPineScriptは以下の通りです。
###ここにボリンジャーバンドのPineScriptを貼り付ける###
するとchatGPTからは以下のような回答がありました。
//@version=6
indicator(title="SMA and Bollinger Bands Combined", shorttitle="SMA+BB", overlay=true, timeframe="", timeframe_gaps=true)

// Inputs
// Moving Average (SMA)
sma_length = input.int(9, title="SMA Length", minval=1)
sma_source = input(close, title="SMA Source")

// Bollinger Bands
bb_length = input.int(20, title="BB Length", minval=1)
bb_source = input(close, title="BB Source")
bb_mult = input.float(2.0, title="BB StdDev Multiplier", minval=0.001, maxval=50)

// Offset
plot_offset = input.int(0, title="Plot Offset", minval=-500, maxval=500)

// Calculation
// Simple Moving Average (SMA)
sma = ta.sma(sma_source, sma_length)

// Bollinger Bands
basis = ta.sma(bb_source, bb_length)
stdev = ta.stdev(bb_source, bb_length)
upper_band = basis + (bb_mult * stdev)
lower_band = basis - (bb_mult * stdev)

// Plotting
plot(sma, title="SMA", color=color.blue, offset=plot_offset)
plot(basis, title="BB Basis", color=color.yellow, offset=plot_offset)
p1 = plot(upper_band, title="BB Upper Band", color=color.green, offset=plot_offset)
p2 = plot(lower_band, title="BB Lower Band", color=color.red, offset=plot_offset)
fill(p1, p2, title="BB Fill", color=color.new(color.green, 90))
手順④ TradingViewにオリジナルインジケータを表示させる
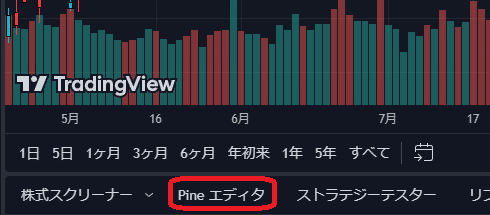
画面左下のPineエディタボタンを押します。
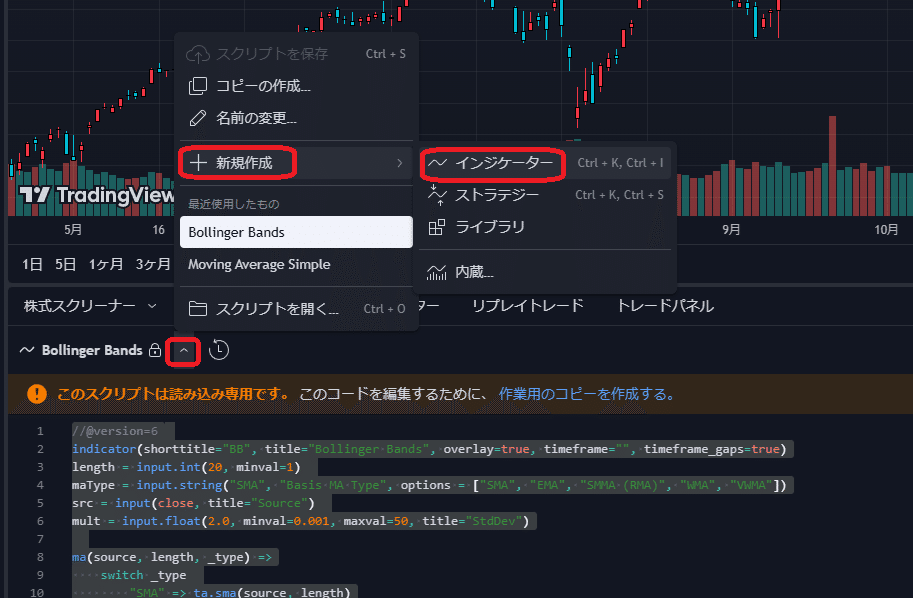
下記参考画像のように選択していき、インジケータを選択してください。
コードが入力できる状態になるはずです。そうしたら先程合体させたオリジナルコードをここにコピペしましょう。コピペしたらチャートに追加ボタンを押します。
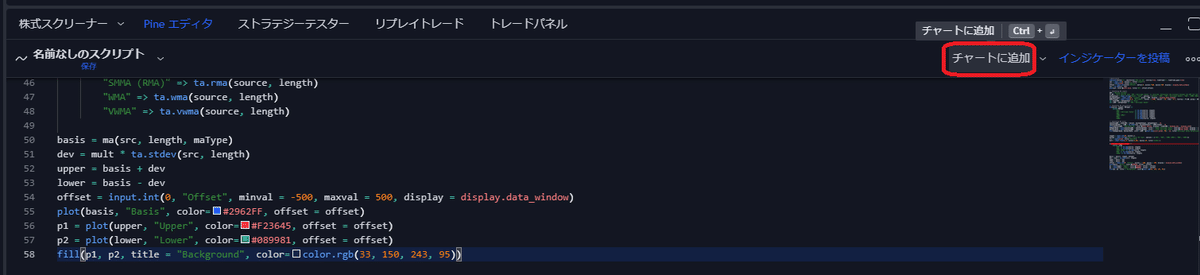
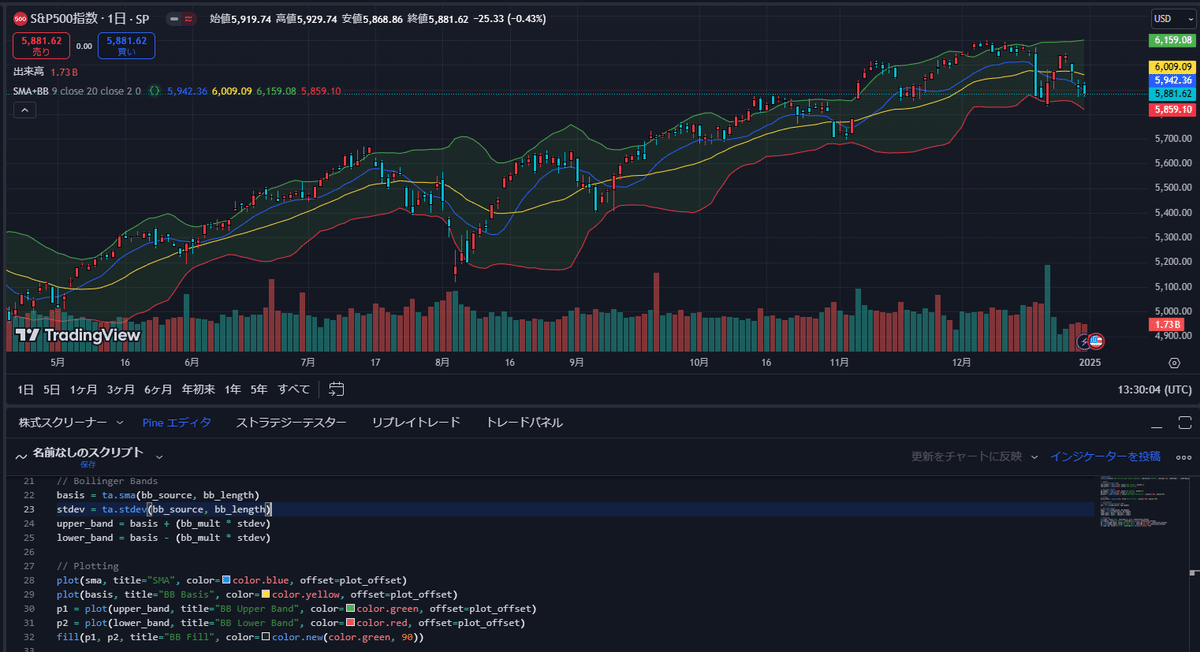
エラーがなければチャート上に希望のインジゲーターが表示されるはずです!
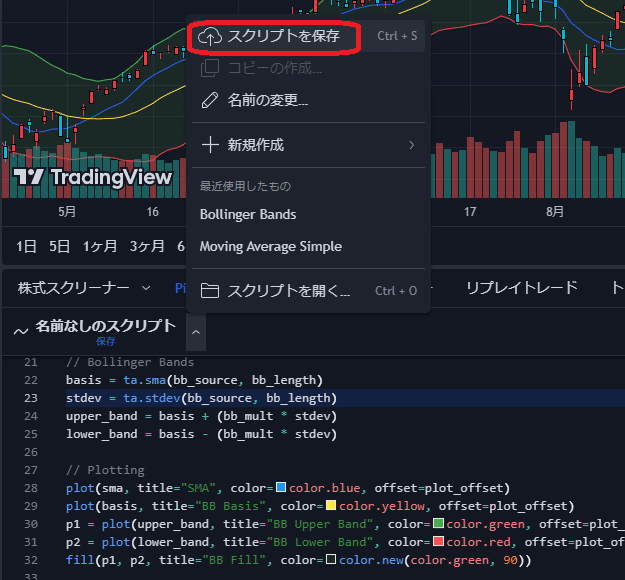
手順⑤ PineScriptを保存する
満足できるインジゲーターが作成できたら保存しましょう。下図のようにスクリプトを保存ボタンを押してください。
保存したオリジナルインジゲーターは、TradingView画面左上の「インジゲーター」→「パーソナル」からいつでも表示することができます。お疲れ様でした。
おわりに
プログラミング言語を扱うので少々ハードルが高そうに見えますが、普段使うインジゲーターを一つに統合してしまえばインジゲーター表示数を1つにできるのでTradingViewに課金しなくてもほとんど困ることがなくなります。ぜひ試してみてください。コメントもいただけると励みになります!