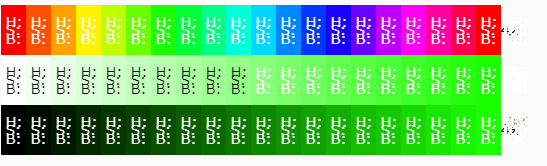
HSBで色探す。

基本はp5.jsを使用。
全部ChatGPT4くんがやった。
関連
ベース
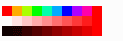
function setup() {
  createCanvas(110, 30);
  colorMode(HSB, 360, 100, 100); // HSBカラーモードを設定し、範囲を360, 100, 100にします。

  noStroke(); // 線を描かないようにします。

  // hの値を変化させる。
  for (let i = 0; i < 10; i++) {
    let h = map(i, 0, 9, 0, 360);
    fill(h, 100, 100); // sとbは固定して100にします。
    rect(i * 10, 0, 10, 10); // 10x10の矩形を描画します。
  }

  // sの値を変化させる。
  for (let i = 0; i < 10; i++) {
    let s = map(i, 0, 9, 0, 100);
    fill(0, s, 100); // hとbは固定して0と100にします。
    rect(i * 10, 10, 10, 10); // 10x10の矩形を描画します。
  }

  // bの値を変化させる。
  for (let i = 0; i < 10; i++) {
    let b = map(i, 0, 9, 0, 100);
    fill(0, 100, b); // hとsは固定して0と100にします。
    rect(i * 10, 20, 10, 10); // 10x10の矩形を描画します。
  }
}
htmlと.jsファイルの場合
index.html
<!DOCTYPE html>
<html lang="en">
<head>
  <meta charset="UTF-8">
  <meta name="viewport" content="width=device-width, initial-scale=1.0">
  <title>Canvas Drawing</title>
  <style>
    body {
      display: flex;
      justify-content: center;
      align-items: center;
      height: 100vh;
      margin: 0;
    }
    canvas {
      border: 1px solid black;
    }
  </style>
</head>
<body>
  <canvas id="myCanvas" width="110" height="30"></canvas>
  <script src="main.js"></script>
</body>
</html>
main.js
document.addEventListener("DOMContentLoaded", function() {
  const canvas = document.getElementById('myCanvas');
  const ctx = canvas.getContext('2d');

  // Function to convert HSB to RGB
  function hsbToRgb(h, s, b) {
    s /= 100;
    b /= 100;
    const k = (n) => (n + h / 60) % 6;
    const f = (n) => b * (1 - s * Math.max(0, Math.min(k(n), 4 - k(n), 1)));
    return [
      Math.round(255 * f(5)),
      Math.round(255 * f(3)),
      Math.round(255 * f(1))
    ];
  }

  // hの値を変化させる。
  for (let i = 0; i < 10; i++) {
    let h = i * 36; // map(i, 0, 9, 0, 360)
    let [r, g, b] = hsbToRgb(h, 100, 100);
    ctx.fillStyle = `rgb(${r}, ${g}, ${b})`;
    ctx.fillRect(i * 10, 0, 10, 10); // 10x10の矩形を描画します。
  }

  // sの値を変化させる。
  for (let i = 0; i < 10; i++) {
    let s = i * 10; // map(i, 0, 9, 0, 100)
    let [r, g, b] = hsbToRgb(0, s, 100);
    ctx.fillStyle = `rgb(${r}, ${g}, ${b})`;
    ctx.fillRect(i * 10, 10, 10, 10); // 10x10の矩形を描画します。
  }

  // bの値を変化させる。
  for (let i = 0; i < 10; i++) {
    let b = i * 10; // map(i, 0, 9, 0, 100)
    let [r, g, bColor] = hsbToRgb(0, 100, b);
    ctx.fillStyle = `rgb(${r}, ${g}, ${bColor})`;
    ctx.fillRect(i * 10, 20, 10, 10); // 10x10の矩形を描画します。
  }
});
Google Colabの場合(%%html)
%%html
<!DOCTYPE html>
<html lang="en">
<head>
  <meta charset="UTF-8">
  <meta name="viewport" content="width=device-width, initial-scale=1.0">
  <title>Canvas Drawing</title>
  <style>
    body {
      display: flex;
      justify-content: center;
      align-items: center;
      height: 100vh;
      margin: 0;
    }
    canvas {
      border: 1px solid black;
    }
  </style>
</head>
<body>
  <canvas id="myCanvas" width="110" height="30"></canvas>
  <script>
    function hsbToRgb(h, s, b) {
      s /= 100;
      b /= 100;
      const k = (n) => (n + h / 60) % 6;
      const f = (n) => b * (1 - s * Math.max(0, Math.min(k(n), 4 - k(n), 1)));
      return [
        Math.round(255 * f(5)),
        Math.round(255 * f(3)),
        Math.round(255 * f(1))
      ];
    }

    function draw() {
      const canvas = document.getElementById('myCanvas');
      const ctx = canvas.getContext('2d');

      // hの値を変化させる。
      for (let i = 0; i < 10; i++) {
        let h = i * 36; // map(i, 0, 9, 0, 360)
        let [r, g, b] = hsbToRgb(h, 100, 100);
        ctx.fillStyle = `rgb(${r}, ${g}, ${b})`;
        ctx.fillRect(i * 10, 0, 10, 10); // 10x10の矩形を描画します。
      }

      // sの値を変化させる。
      for (let i = 0; i < 10; i++) {
        let s = i * 10; // map(i, 0, 9, 0, 100)
        let [r, g, b] = hsbToRgb(0, s, 100);
        ctx.fillStyle = `rgb(${r}, ${g}, ${b})`;
        ctx.fillRect(i * 10, 10, 10, 10); // 10x10の矩形を描画します。
      }

      // bの値を変化させる。
      for (let i = 0; i < 10; i++) {
        let b = i * 10; // map(i, 0, 9, 0, 100)
        let [r, g, bColor] = hsbToRgb(0, 100, b);
        ctx.fillStyle = `rgb(${r}, ${g}, ${bColor})`;
        ctx.fillRect(i * 10, 20, 10, 10); // 10x10の矩形を描画します。
      }
    }

    draw();
  </script>
</body>
</html>
%%htmlは、Jupyter NotebookやGoogle Colabで使用できるマジックコマンドです。このマジックコマンドを使用すると、セル内のHTMLコードをそのままレンダリングして表示することができます。Pythonコードの中に埋め込まれるのではなく、HTMLコードとして直接実行されます。
使用する理由
簡単なHTMLレンダリング: Pythonコードの中に埋め込むことなく、簡単にHTMLコードをレンダリングできます。
即時性: セルの内容がそのままHTMLとして解釈されるため、即時に効果を確認できます。
注意点
%%htmlマジックコマンドを使用すると、そのセルの内容はすべてHTMLとして扱われるため、Pythonコードを混在させることはできません。
PythonからHTMLを生成して表示したい場合には、IPython.displayのHTML関数を使用します。
Google Colabの場合(IPython.display)
from IPython.display import display, HTML

html_code = """
<!DOCTYPE html>
<html lang="en">
<head>
  <meta charset="UTF-8">
  <meta name="viewport" content="width=device-width, initial-scale=1.0">
  <title>Canvas Drawing</title>
  <style>
    body {
      display: flex;
      justify-content: center;
      align-items: center;
      height: 100vh;
      margin: 0;
    }
    canvas {
      border: 1px solid black;
    }
  </style>
</head>
<body>
  <canvas id="myCanvas" width="110" height="30"></canvas>
  <script>
    function hsbToRgb(h, s, b) {
      s /= 100;
      b /= 100;
      const k = (n) => (n + h / 60) % 6;
      const f = (n) => b * (1 - s * Math.max(0, Math.min(k(n), 4 - k(n), 1)));
      return [
        Math.round(255 * f(5)),
        Math.round(255 * f(3)),
        Math.round(255 * f(1))
      ];
    }

    function draw() {
      const canvas = document.getElementById('myCanvas');
      const ctx = canvas.getContext('2d');

      // hの値を変化させる。
      for (let i = 0; i < 10; i++) {
        let h = i * 36; // map(i, 0, 9, 0, 360)
        let [r, g, b] = hsbToRgb(h, 100, 100);
        ctx.fillStyle = `rgb(${r}, ${g}, ${b})`;
        ctx.fillRect(i * 10, 0, 10, 10); // 10x10の矩形を描画します。
      }

      // sの値を変化させる。
      for (let i = 0; i < 10; i++) {
        let s = i * 10; // map(i, 0, 9, 0, 100)
        let [r, g, b] = hsbToRgb(0, s, 100);
        ctx.fillStyle = `rgb(${r}, ${g}, ${b})`;
        ctx.fillRect(i * 10, 10, 10, 10); // 10x10の矩形を描画します。
      }

      // bの値を変化させる。
      for (let i = 0; i < 10; i++) {
        let b = i * 10; // map(i, 0, 9, 0, 100)
        let [r, g, bColor] = hsbToRgb(0, 100, b);
        ctx.fillStyle = `rgb(${r}, ${g}, ${bColor})`;
        ctx.fillRect(i * 10, 20, 10, 10); // 10x10の矩形を描画します。
      }
    }

    draw();
  </script>
</body>
</html>
"""

display(HTML(html_code))
失敗例1
DOMContentLoadedは失敗する。
from IPython.display import HTML, display

html_code = """
<!DOCTYPE html>
<html lang="en">
<head>
  <meta charset="UTF-8">
  <meta name="viewport" content="width=device-width, initial-scale=1.0">
  <title>Canvas Drawing</title>
  <style>
    body {
      display: flex;
      justify-content: center;
      align-items: center;
      height: 100vh;
      margin: 0;
    }
    canvas {
      border: 1px solid black;
    }
  </style>
</head>
<body>
  <canvas id="myCanvas" width="110" height="30"></canvas>
  <script>
    document.addEventListener("DOMContentLoaded", function() {
      const canvas = document.getElementById('myCanvas');
      const ctx = canvas.getContext('2d');

      // Function to convert HSB to RGB
      function hsbToRgb(h, s, b) {
        s /= 100;
        b /= 100;
        const k = (n) => (n + h / 60) % 6;
        const f = (n) => b * (1 - s * Math.max(0, Math.min(k(n), 4 - k(n), 1)));
        return [
          Math.round(255 * f(5)),
          Math.round(255 * f(3)),
          Math.round(255 * f(1))
        ];
      }

      // hの値を変化させる。
      for (let i = 0; i < 10; i++) {
        let h = i * 36; // map(i, 0, 9, 0, 360)
        let [r, g, b] = hsbToRgb(h, 100, 100);
        ctx.fillStyle = `rgb(${r}, ${g}, ${b})`;
        ctx.fillRect(i * 10, 0, 10, 10); // 10x10の矩形を描画します。
      }

      // sの値を変化させる。
      for (let i = 0; i < 10; i++) {
        let s = i * 10; // map(i, 0, 9, 0, 100)
        let [r, g, b] = hsbToRgb(0, s, 100);
        ctx.fillStyle = `rgb(${r}, ${g}, ${b})`;
        ctx.fillRect(i * 10, 10, 10, 10); // 10x10の矩形を描画します。
      }

      // bの値を変化させる。
      for (let i = 0; i < 10; i++) {
        let b = i * 10; // map(i, 0, 9, 0, 100)
        let [r, g, bColor] = hsbToRgb(0, 100, b);
        ctx.fillStyle = `rgb(${r}, ${g}, ${bColor})`;
        ctx.fillRect(i * 10, 20, 10, 10); // 10x10の矩形を描画します。
      }
    });
  </script>
</body>
</html>
"""

display(HTML(html_code))
失敗例2
window.onloadは失敗する。
from IPython.display import HTML, display

html_code = """
<!DOCTYPE html>
<html lang="en">
<head>
  <meta charset="UTF-8">
  <meta name="viewport" content="width=device-width, initial-scale=1.0">
  <title>Canvas Drawing</title>
  <style>
    body {
      display: flex;
      justify-content: center;
      align-items: center;
      height: 100vh;
      margin: 0;
    }
    canvas {
      border: 1px solid black;
    }
  </style>
</head>
<body>
  <canvas id="myCanvas" width="110" height="30"></canvas>
  <script>
    function hsbToRgb(h, s, b) {
      s /= 100;
      b /= 100;
      const k = (n) => (n + h / 60) % 6;
      const f = (n) => b * (1 - s * Math.max(0, Math.min(k(n), 4 - k(n), 1)));
      return [
        Math.round(255 * f(5)),
        Math.round(255 * f(3)),
        Math.round(255 * f(1))
      ];
    }

    function draw() {
      const canvas = document.getElementById('myCanvas');
      const ctx = canvas.getContext('2d');

      // hの値を変化させる。
      for (let i = 0; i < 10; i++) {
        let h = i * 36; // map(i, 0, 9, 0, 360)
        let [r, g, b] = hsbToRgb(h, 100, 100);
        ctx.fillStyle = `rgb(${r}, ${g}, ${b})`;
        ctx.fillRect(i * 10, 0, 10, 10); // 10x10の矩形を描画します。
      }

      // sの値を変化させる。
      for (let i = 0; i < 10; i++) {
        let s = i * 10; // map(i, 0, 9, 0, 100)
        let [r, g, b] = hsbToRgb(0, s, 100);
        ctx.fillStyle = `rgb(${r}, ${g}, ${b})`;
        ctx.fillRect(i * 10, 10, 10, 10); // 10x10の矩形を描画します。
      }

      // bの値を変化させる。
      for (let i = 0; i < 10; i++) {
        let b = i * 10; // map(i, 0, 9, 0, 100)
        let [r, g, bColor] = hsbToRgb(0, 100, b);
        ctx.fillStyle = `rgb(${r}, ${g}, ${bColor})`;
        ctx.fillRect(i * 10, 20, 10, 10); // 10x10の矩形を描画します。
      }
    }

    window.onload = draw;
  </script>
</body>
</html>
"""

display(HTML(html_code))
失敗の検証
DOMContentLoadedが失敗する検証コード
from IPython.display import display, HTML

html_code = """
<!DOCTYPE html>
<html lang="en">
<head>
  <meta charset="UTF-8">
  <meta name="viewport" content="width=device-width, initial-scale=1.0">
  <title>Canvas Test</title>
</head>
<body>
  <canvas id="myCanvas" width="200" height="50" style="border:1px solid #000000;"></canvas>
  <script>
    document.addEventListener("DOMContentLoaded", function() {
      const canvas = document.getElementById('myCanvas');
      const ctx = canvas.getContext('2d');
      ctx.font = "20px Arial";
      ctx.fillText("Hello, World!", 10, 30);
    });
  </script>
</body>
</html>
"""

display(HTML(html_code))
window.onloadが失敗する検証コード
from IPython.display import display, HTML

html_code = """
<!DOCTYPE html>
<html lang="en">
<head>
  <meta charset="UTF-8">
  <meta name="viewport" content="width=device-width, initial-scale=1.0">
  <title>Canvas Test</title>
</head>
<body>
  <canvas id="myCanvas" width="200" height="50" style="border:1px solid #000000;"></canvas>
  <script>
    window.onload = function() {
      const canvas = document.getElementById('myCanvas');
      const ctx = canvas.getContext('2d');
      ctx.font = "20px Arial";
      ctx.fillText("Hello, World!", 10, 30);
    };
  </script>
</body>
</html>
"""

display(HTML(html_code))
失敗する理由(多分)
Google ColabのUIがすでに各種イベントを発火させてしまっている。
そこに挿入するためのhtmlをGoogle Colab上で作成しても、それらのイベントはすでに終わっている。
挿入するためのhtmlをGoogle Colab上で作成した場合、それのレンダリングはやはりブラウザが行うが、ブラウザはGoogle Colabの画面を開いた時点でDOMContentLoadedなどを発火させ終わったと思っている。なので再発火しない。
Google Colabでスクリプトを実行し、その場でhtmlを作成するなどした場合、DOMの構築やウィンドウのロードは意味がないのであって、単純にそれらの処理が終わるまでユーザーをまたすだけである。
イベント強制再発行なら動く可能性があるが、それをする意味がない上、Google Colab側がなんやら動いてしまう可能性があるので実験するの怖い。
1. Google ColabのUI動作
出力フレームの生成: Google ColabのUIが出力フレームを作成し、そのフレームのDOMが構築されるときに DOMContentLoaded イベントが発火します。
HTMLコードの挿入: ユーザーがPythonセルで display(HTML(html_code)) を実行すると、そのHTMLコードがすでに構築された出力フレームに挿入されます。
2. イベントのタイミング
DOMContentLoaded イベント: フレームが初めてロードされ、DOMが構築された際に一度だけ発火します。その後、このフレーム内で新たにHTMLが挿入されても DOMContentLoaded イベントは再発火しません。
window.onload イベント: 同様に、フレーム全体がロードされた後に発火しますが、新たに挿入されたHTMLには影響を与えません。
これにより、以下のような現象が起こります:
HTMLが出力フレームに挿入されるとき、DOMContentLoaded イベントや window.onload イベントがすでに終了しているため、これらのイベントに依存するスクリプトは期待通りに動作しないことがあります。
動くやつ
普段htmlとJavaScriptを用いる場合の、
ユーザーを待たせないようになんやらかんやらみたいな処理はGoogle Colabでは普通に許容される。というか、普通にPython実行した時も処理終わるまで待つ。ただしhtmlのレンダリングのタイミングはこちらの意図したとおりにならない可能性がある。
from IPython.display import display, HTML

html_code = """
<!DOCTYPE html>
<html lang="en">
<head>
  <meta charset="UTF-8">
  <meta name="viewport" content="width=device-width, initial-scale=1.0">
  <title>Canvas Test</title>
</head>
<body>
  <canvas id="myCanvas" width="200" height="50" style="border:1px solid #000000;"></canvas>
  <script>
    function draw() {
      const canvas = document.getElementById('myCanvas');
      const ctx = canvas.getContext('2d');
      ctx.font = "20px Arial";
      ctx.fillText("Hello, World!", 10, 30);
    }

    draw();
  </script>
</body>
</html>
"""

display(HTML(html_code))
セルのw,h共通変数
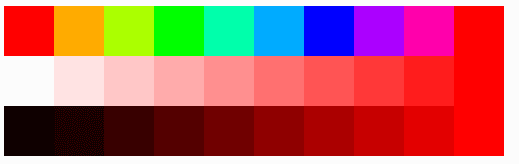
let cellWidth = 50;
let cellHeight = 50;

function setup() {
  createCanvas(10*cellWidth, 3 * cellHeight);
  colorMode(HSB, 360, 100, 100); // HSBカラーモードを設定し、範囲を360, 100, 100にします。

  noStroke(); // 線を描かないようにします。

  // hの値を変化させる。
  for (let i = 0; i < 10; i++) {
    let h = map(i, 0, 9, 0, 360);
    fill(h, 100, 100); // sとbは固定して100にします。
    rect(i * cellWidth, 0, cellWidth, cellHeight); // 矩形を描画します。
  }

  // sの値を変化させる。
  for (let i = 0; i < 10; i++) {
    let s = map(i, 0, 9, 0, 100);
    fill(0, s, 100); // hとbは固定して0と100にします。
    rect(i * cellWidth, cellHeight, cellWidth, cellHeight); // 矩形を描画します。
  }

  // bの値を変化させる。
  for (let i = 0; i < 10; i++) {
    let b = map(i, 0, 9, 0, 100);
    fill(0, 100, b); // hとsは固定して0と100にします。
    rect(i * cellWidth, 2 * cellHeight, cellWidth, cellHeight); // 矩形を描画します。
  }
}
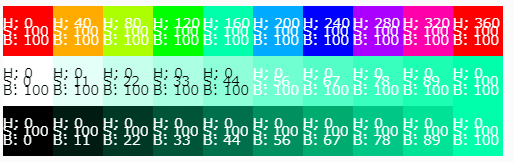
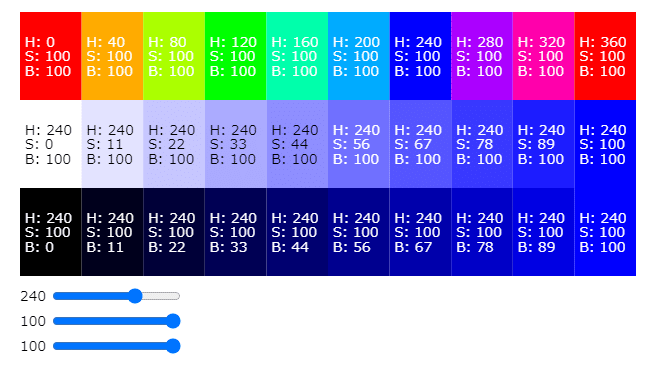
HSB値の表示
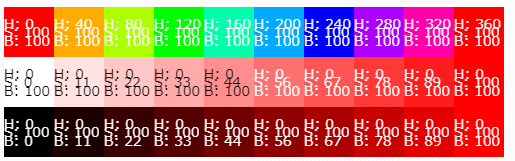
p5.jsの場合
let cellWidth = 50;
let cellHeight = 50;

function setup() {
  createCanvas(10 * cellWidth, 3 * cellHeight);
  colorMode(HSB, 360, 100, 100);

  noStroke();

  // hの値を変化させる。
  for (let i = 0; i < 10; i++) {
    let h = map(i, 0, 9, 0, 360);
    fill(h, 100, 100);
    rect(i * cellWidth, 0, cellWidth, cellHeight);
    displayHSBText(h, 100, 100, i * cellWidth, 0);
  }

  // sの値を変化させる。
  for (let i = 0; i < 10; i++) {
    let s = map(i, 0, 9, 0, 100);
    fill(0, s, 100);
    rect(i * cellWidth, cellHeight, cellWidth, cellHeight);
    displayHSBText(0, s, 100, i * cellWidth, cellHeight);
  }

  // bの値を変化させる。
  for (let i = 0; i < 10; i++) {
    let b = map(i, 0, 9, 0, 100);
    fill(0, 100, b);
    rect(i * cellWidth, 2 * cellHeight, cellWidth, cellHeight);
    displayHSBText(0, 100, b, i * cellWidth, 2 * cellHeight);
  }
}

function displayHSBText(h, s, b, x, y) {
  let textColor = getContrastingColor(h, s, b);
  fill(textColor);
  textAlign(LEFT, CENTER);
  textSize(14);
  text(`H: ${Math.round(h)}`, x, y + cellHeight / 3);
  text(`S: ${Math.round(s)}`, x, y + cellHeight / 2);
  text(`B: ${Math.round(b)}`, x, y + 2 * cellHeight / 3);
}

function getContrastingColor(h, s, b) {
  if (b > 50 && s < 50) {
    return color(0); // 黒色
  } else if (b > 50 && s > 50) {
    return color(255); // 白色
  } else {
    return color(255); // 白色
  }
}
htmlと.jsファイルの場合
index.html
<!DOCTYPE html>
<html lang="en">
<head>
  <meta charset="UTF-8">
  <meta name="viewport" content="width=device-width, initial-scale=1.0">
  <title>Canvas Drawing</title>
  <style>
    body {
      display: flex;
      justify-content: center;
      align-items: center;
      height: 100vh;
      margin: 0;
    }
    canvas {
      border: 1px solid black;
    }
  </style>
</head>
<body>
  <canvas id="myCanvas" width="500" height="150"></canvas>
  <script src="main.js"></script>
</body>
</html>
main.js
const cellWidth = 50;
const cellHeight = 50;
const canvas = document.getElementById('myCanvas');
const ctx = canvas.getContext('2d');

function map(value, start1, stop1, start2, stop2) {
  return ((value - start1) / (stop1 - start1)) * (stop2 - start2) + start2;
}

function hsbToRgb(h, s, b) {
  s /= 100;
  b /= 100;
  const k = (n) => (n + h / 60) % 6;
  const f = (n) => b * (1 - s * Math.max(0, Math.min(k(n), 4 - k(n), 1)));
  return [
    Math.round(255 * f(5)),
    Math.round(255 * f(3)),
    Math.round(255 * f(1))
  ];
}

function drawRect(x, y, width, height, color) {
  ctx.fillStyle = color;
  ctx.fillRect(x, y, width, height);
}

function displayHSBText(h, s, b, x, y) {
  const textColor = getContrastingColor(h, s, b);
  ctx.fillStyle = textColor;
  ctx.textAlign = "left";
  ctx.textBaseline = "middle";
  ctx.font = "14px Arial";
  ctx.fillText(`H: ${Math.round(h)}`, x, y + cellHeight / 3);
  ctx.fillText(`S: ${Math.round(s)}`, x, y + cellHeight / 2);
  ctx.fillText(`B: ${Math.round(b)}`, x, y + 2 * cellHeight / 3);
}

function getContrastingColor(h, s, b) {
  if (b > 50 && s < 50) {
    return "black"; // 黒色
  } else if (b > 50 && s > 50) {
    return "white"; // 白色
  } else {
    return "white"; // 白色
  }
}

function setup() {
  // hの値を変化させる。
  for (let i = 0; i < 10; i++) {
    let h = map(i, 0, 9, 0, 360);
    const [r, g, b] = hsbToRgb(h, 100, 100);
    drawRect(i * cellWidth, 0, cellWidth, cellHeight, `rgb(${r}, ${g}, ${b})`);
    displayHSBText(h, 100, 100, i * cellWidth, 0);
  }

  // sの値を変化させる。
  for (let i = 0; i < 10; i++) {
    let s = map(i, 0, 9, 0, 100);
    const [r, g, b] = hsbToRgb(0, s, 100);
    drawRect(i * cellWidth, cellHeight, cellWidth, cellHeight, `rgb(${r}, ${g}, ${b})`);
    displayHSBText(0, s, 100, i * cellWidth, cellHeight);
  }

  // bの値を変化させる。
  for (let i = 0; i < 10; i++) {
    let b = map(i, 0, 9, 0, 100);
    const [r, g, bColor] = hsbToRgb(0, 100, b);
    drawRect(i * cellWidth, 2 * cellHeight, cellWidth, cellHeight, `rgb(${r}, ${g}, ${bColor})`);
    displayHSBText(0, 100, b, i * cellWidth, 2 * cellHeight);
  }
}

// ドキュメントが読み込まれたときにセットアップ関数を呼び出す
window.onload = setup;
Google Colabの場合(%%html)
%%html
<!DOCTYPE html>
<html lang="en">
<head>
  <meta charset="UTF-8">
  <meta name="viewport" content="width=device-width, initial-scale=1.0">
  <title>Canvas Drawing</title>
  <style>
    body {
      display: flex;
      justify-content: center;
      align-items: center;
      height: 100vh;
      margin: 0;
    }
    canvas {
      border: 1px solid black;
    }
  </style>
</head>
<body>
  <canvas id="myCanvas" width="500" height="150"></canvas>
  <script>
    (function() {
      const cellWidth = 50;
      const cellHeight = 50;
      const canvas = document.getElementById('myCanvas');
      const ctx = canvas.getContext('2d');

      function map(value, start1, stop1, start2, stop2) {
        return ((value - start1) / (stop1 - start1)) * (stop2 - start2) + start2;
      }

      function hsbToRgb(h, s, b) {
        s /= 100;
        b /= 100;
        const k = (n) => (n + h / 60) % 6;
        const f = (n) => b * (1 - s * Math.max(0, Math.min(k(n), 4 - k(n), 1)));
        return [
          Math.round(255 * f(5)),
          Math.round(255 * f(3)),
          Math.round(255 * f(1))
        ];
      }

      function drawRect(x, y, width, height, color) {
        ctx.fillStyle = color;
        ctx.fillRect(x, y, width, height);
      }

      function displayHSBText(h, s, b, x, y) {
        const textColor = getContrastingColor(h, s, b);
        ctx.fillStyle = textColor;
        ctx.textAlign = "left";
        ctx.textBaseline = "middle";
        ctx.font = "14px Arial";
        ctx.fillText(`H: ${Math.round(h)}`, x, y + cellHeight / 3);
        ctx.fillText(`S: ${Math.round(s)}`, x, y + cellHeight / 2);
        ctx.fillText(`B: ${Math.round(b)}`, x, y + 2 * cellHeight / 3);
      }

      function getContrastingColor(h, s, b) {
        if (b > 50 && s < 50) {
          return "black"; // 黒色
        } else if (b > 50 && s > 50) {
          return "white"; // 白色
        } else {
          return "white"; // 白色
        }
      }

      function setup() {
        // hの値を変化させる。
        for (let i = 0; i < 10; i++) {
          let h = map(i, 0, 9, 0, 360);
          const [r, g, b] = hsbToRgb(h, 100, 100);
          drawRect(i * cellWidth, 0, cellWidth, cellHeight, `rgb(${r}, ${g}, ${b})`);
          displayHSBText(h, 100, 100, i * cellWidth, 0);
        }

        // sの値を変化させる。
        for (let i = 0; i < 10; i++) {
          let s = map(i, 0, 9, 0, 100);
          const [r, g, b] = hsbToRgb(0, s, 100);
          drawRect(i * cellWidth, cellHeight, cellWidth, cellHeight, `rgb(${r}, ${g}, ${b})`);
          displayHSBText(0, s, 100, i * cellWidth, cellHeight);
        }

        // bの値を変化させる。
        for (let i = 0; i < 10; i++) {
          let b = map(i, 0, 9, 0, 100);
          const [r, g, bColor] = hsbToRgb(0, 100, b);
          drawRect(i * cellWidth, 2 * cellHeight, cellWidth, cellHeight, `rgb(${r}, ${g}, ${bColor})`);
          displayHSBText(0, 100, b, i * cellWidth, 2 * cellHeight);
        }
      }

      setup(); // 即時にsetup関数を実行
    })();
  </script>
</body>
</html>
HSB可変
let cellWidth = 50;
let cellHeight = 50;

let fix_H = 0;
let fix_S = 100;
let fix_B = 100;

function setup() {
  createCanvas(10 * cellWidth, 3 * cellHeight);
  colorMode(HSB, 360, 100, 100);

  noStroke();

  drawRectangles();
}

function drawRectangles() {
  clear();

  // hの値を変化させる。
  for (let i = 0; i < 10; i++) {
    let h = map(i, 0, 9, 0, 360);
    fill(h, fix_S, fix_B);
    rect(i * cellWidth, 0, cellWidth, cellHeight);
    displayHSBText(h, 100, 100, i * cellWidth, 0);
  }

  // sの値を変化させる。
  for (let i = 0; i < 10; i++) {
    let s = map(i, 0, 9, 0, 100);
    fill(fix_H, s, fix_B);
    rect(i * cellWidth, cellHeight, cellWidth, cellHeight);
    displayHSBText(0, s, 100, i * cellWidth, cellHeight);
  }

  // bの値を変化させる。
  for (let i = 0; i < 10; i++) {
    let b = map(i, 0, 9, 0, 100);
    fill(fix_H, fix_S, b);
    rect(i * cellWidth, 2 * cellHeight, cellWidth, cellHeight);
    displayHSBText(0, 100, b, i * cellWidth, 2 * cellHeight);
  }
}

function mousePressed() {
  let col = floor(mouseX / cellWidth);

  // Check the row that was clicked
  if (mouseY < cellHeight) {
    fix_H = map(col, 0, 9, 0, 360);
  } else if (mouseY < 2 * cellHeight) {
    fix_S = map(col, 0, 9, 0, 100);
  } else if (mouseY < 3 * cellHeight) {
    fix_B = map(col, 0, 9, 0, 100);
  }

  drawRectangles();  // Update the display after setting the fix_H, fix_S, or fix_B
}

function displayHSBText(h, s, b, x, y) {
  let textColor = getContrastingColor(h, s, b);
  fill(textColor);
  textAlign(LEFT, CENTER);
  textSize(14);
  text(`H: ${Math.round(h)}`, x, y + cellHeight / 3);
  text(`S: ${Math.round(s)}`, x, y + cellHeight / 2);
  text(`B: ${Math.round(b)}`, x, y + 2 * cellHeight / 3);
}

function getContrastingColor(h, s, b) {
  if (b > 50 && s < 50) {
    return color(0); // 黒色
  } else {
    return color(255); // 白色
  }
}
htmlと.jsファイルの場合
index.html
<!DOCTYPE html>
<html lang="en">
<head>
  <meta charset="UTF-8">
  <meta name="viewport" content="width=device-width, initial-scale=1.0">
  <title>Canvas Drawing</title>
  <style>
    body {
      display: flex;
      justify-content: center;
      align-items: center;
      height: 100vh;
      margin: 0;
    }
    canvas {
      border: 1px solid black;
    }
  </style>
</head>
<body>
  <canvas id="myCanvas" width="500" height="150"></canvas>
  <script src="main.js"></script>
</body>
</html>
main.js
const cellWidth = 50;
const cellHeight = 50;
const canvas = document.getElementById('myCanvas');
const ctx = canvas.getContext('2d');

let fix_H = 0;
let fix_S = 100;
let fix_B = 100;

canvas.addEventListener('click', function(event) {
  const rect = canvas.getBoundingClientRect();
  const mouseX = event.clientX - rect.left;
  const mouseY = event.clientY - rect.top;
  mousePressed(mouseX, mouseY);
});

function map(value, start1, stop1, start2, stop2) {
  return ((value - start1) / (stop1 - start1)) * (stop2 - start2) + start2;
}

function hsbToRgb(h, s, b) {
  s /= 100;
  b /= 100;
  const k = (n) => (n + h / 60) % 6;
  const f = (n) => b * (1 - s * Math.max(0, Math.min(k(n), 4 - k(n), 1)));
  return [
    Math.round(255 * f(5)),
    Math.round(255 * f(3)),
    Math.round(255 * f(1))
  ];
}

function drawRect(x, y, width, height, color) {
  ctx.fillStyle = color;
  ctx.fillRect(x, y, width, height);
}

function displayHSBText(h, s, b, x, y) {
  const textColor = getContrastingColor(h, s, b);
  ctx.fillStyle = textColor;
  ctx.textAlign = "left";
  ctx.textBaseline = "middle";
  ctx.font = "14px Arial";
  ctx.fillText(`H: ${Math.round(h)}`, x, y + cellHeight / 3);
  ctx.fillText(`S: ${Math.round(s)}`, x, y + cellHeight / 2);
  ctx.fillText(`B: ${Math.round(b)}`, x, y + 2 * cellHeight / 3);
}

function getContrastingColor(h, s, b) {
  if (b > 50 && s < 50) {
    return "black"; // 黒色
  } else {
    return "white"; // 白色
  }
}

function setup() {
  drawRectangles();
}

function drawRectangles() {
  ctx.clearRect(0, 0, canvas.width, canvas.height);

  // hの値を変化させる。
  for (let i = 0; i < 10; i++) {
    let h = map(i, 0, 9, 0, 360);
    const [r, g, b] = hsbToRgb(h, fix_S, fix_B);
    drawRect(i * cellWidth, 0, cellWidth, cellHeight, `rgb(${r}, ${g}, ${b})`);
    displayHSBText(h, 100, 100, i * cellWidth, 0);
  }

  // sの値を変化させる。
  for (let i = 0; i < 10; i++) {
    let s = map(i, 0, 9, 0, 100);
    const [r, g, b] = hsbToRgb(fix_H, s, fix_B);
    drawRect(i * cellWidth, cellHeight, cellWidth, cellHeight, `rgb(${r}, ${g}, ${b})`);
    displayHSBText(0, s, 100, i * cellWidth, cellHeight);
  }

  // bの値を変化させる。
  for (let i = 0; i < 10; i++) {
    let b = map(i, 0, 9, 0, 100);
    const [r, g, bColor] = hsbToRgb(fix_H, fix_S, b);
    drawRect(i * cellWidth, 2 * cellHeight, cellWidth, cellHeight, `rgb(${r}, ${g}, ${bColor})`);
    displayHSBText(0, 100, b, i * cellWidth, 2 * cellHeight);
  }
}

function mousePressed(mouseX, mouseY) {
  let col = Math.floor(mouseX / cellWidth);

  // Check the row that was clicked
  if (mouseY < cellHeight) {
    fix_H = map(col, 0, 9, 0, 360);
  } else if (mouseY < 2 * cellHeight) {
    fix_S = map(col, 0, 9, 0, 100);
  } else if (mouseY < 3 * cellHeight) {
    fix_B = map(col, 0, 9, 0, 100);
  }

  drawRectangles();  // Update the display after setting the fix_H, fix_S, or fix_B
}

// ドキュメントが読み込まれたときにセットアップ関数を呼び出す
document.addEventListener("DOMContentLoaded", setup);
Google Colabの場合(%%html)
%%html
<!DOCTYPE html>
<html lang="en">
<head>
  <meta charset="UTF-8">
  <meta name="viewport" content="width=device-width, initial-scale=1.0">
  <title>Canvas Drawing</title>
  <style>
    body {
      display: flex;
      justify-content: center;
      align-items: center;
      height: 100vh;
      margin: 0;
    }
    canvas {
      border: 1px solid black;
    }
  </style>
</head>
<body>
  <canvas id="myCanvas" width="500" height="150"></canvas>
  <script>
    (function() {
      const cellWidth = 50;
      const cellHeight = 50;
      const canvas = document.getElementById('myCanvas');
      const ctx = canvas.getContext('2d');

      let fix_H = 0;
      let fix_S = 100;
      let fix_B = 100;

      canvas.addEventListener('click', function(event) {
        const rect = canvas.getBoundingClientRect();
        const mouseX = event.clientX - rect.left;
        const mouseY = event.clientY - rect.top;
        mousePressed(mouseX, mouseY);
      });

      function map(value, start1, stop1, start2, stop2) {
        return ((value - start1) / (stop1 - start1)) * (stop2 - start2) + start2;
      }

      function hsbToRgb(h, s, b) {
        s /= 100;
        b /= 100;
        const k = (n) => (n + h / 60) % 6;
        const f = (n) => b * (1 - s * Math.max(0, Math.min(k(n), 4 - k(n), 1)));
        return [
          Math.round(255 * f(5)),
          Math.round(255 * f(3)),
          Math.round(255 * f(1))
        ];
      }

      function drawRect(x, y, width, height, color) {
        ctx.fillStyle = color;
        ctx.fillRect(x, y, width, height);
      }

      function displayHSBText(h, s, b, x, y) {
        const textColor = getContrastingColor(h, s, b);
        ctx.fillStyle = textColor;
        ctx.textAlign = "left";
        ctx.textBaseline = "middle";
        ctx.font = "14px Arial";
        ctx.fillText(`H: ${Math.round(h)}`, x, y + cellHeight / 3);
        ctx.fillText(`S: ${Math.round(s)}`, x, y + cellHeight / 2);
        ctx.fillText(`B: ${Math.round(b)}`, x, y + 2 * cellHeight / 3);
      }

      function getContrastingColor(h, s, b) {
        if (b > 50 && s < 50) {
          return "black"; // 黒色
        } else {
          return "white"; // 白色
        }
      }

      function setup() {
        drawRectangles();
      }

      function drawRectangles() {
        ctx.clearRect(0, 0, canvas.width, canvas.height);

        // hの値を変化させる。
        for (let i = 0; i < 10; i++) {
          let h = map(i, 0, 9, 0, 360);
          const [r, g, b] = hsbToRgb(h, fix_S, fix_B);
          drawRect(i * cellWidth, 0, cellWidth, cellHeight, `rgb(${r}, ${g}, ${b})`);
          displayHSBText(h, 100, 100, i * cellWidth, 0);
        }

        // sの値を変化させる。
        for (let i = 0; i < 10; i++) {
          let s = map(i, 0, 9, 0, 100);
          const [r, g, b] = hsbToRgb(fix_H, s, fix_B);
          drawRect(i * cellWidth, cellHeight, cellWidth, cellHeight, `rgb(${r}, ${g}, ${b})`);
          displayHSBText(0, s, 100, i * cellWidth, cellHeight);
        }

        // bの値を変化させる。
        for (let i = 0; i < 10; i++) {
          let b = map(i, 0, 9, 0, 100);
          const [r, g, bColor] = hsbToRgb(fix_H, fix_S, b);
          drawRect(i * cellWidth, 2 * cellHeight, cellWidth, cellHeight, `rgb(${r}, ${g}, ${bColor})`);
          displayHSBText(0, 100, b, i * cellWidth, 2 * cellHeight);
        }
      }

      function mousePressed(mouseX, mouseY) {
        let col = Math.floor(mouseX / cellWidth);

        // Check the row that was clicked
        if (mouseY < cellHeight) {
          fix_H = map(col, 0, 9, 0, 360);
        } else if (mouseY < 2 * cellHeight) {
          fix_S = map(col, 0, 9, 0, 100);
        } else if (mouseY < 3 * cellHeight) {
          fix_B = map(col, 0, 9, 0, 100);
        }

        drawRectangles();  // Update the display after setting the fix_H, fix_S, or fix_B
      }

      setup(); // 即時にsetup関数を実行
    })();
  </script>
</body>
</html>
列可変、原点追加
const DEFAULT_H = 0;
const DEFAULT_S = 100;
const DEFAULT_B = 100;

const ORIGIN_X = 0;
const ORIGIN_Y = 0;
const RECT_WIDTH = 500;
const RECT_HEIGHT = 150;
const ROW_COUNT = 3;
const COL_COUNT = 20;

let fix_H = DEFAULT_H;
let fix_S = DEFAULT_S;
let fix_B = DEFAULT_B;

function setup() {
  createCanvas(800, 600);
  colorMode(HSB, 360, 100, 100);
  noStroke();

  drawRectangles(ORIGIN_X, ORIGIN_Y, RECT_WIDTH, RECT_HEIGHT, ROW_COUNT, COL_COUNT);
}

function drawRectangles(originX, originY, rectWidth, rectHeight, rowCount, colCount) {
  const cellWidth = rectWidth / colCount;
  const cellHeight = rectHeight / rowCount;

  for (let i = 0; i < colCount; i++) {
    const offset = originX + i * cellWidth;
    let h, s, b;

    // hの値を変化させる。
    h = map(i, 0, colCount - 1, 0, 360);
    fill(h, fix_S, fix_B);
    rect(offset, originY, cellWidth, cellHeight);
    displayHSBText(h, fix_S, fix_B, offset, originY, cellWidth, cellHeight);

    // sの値を変化させる。
    s = map(i, 0, colCount - 1, 0, 100);
    fill(fix_H, s, fix_B);
    rect(offset, originY + cellHeight, cellWidth, cellHeight);
    displayHSBText(fix_H, s, fix_B, offset, originY + cellHeight, cellWidth, cellHeight);

    // bの値を変化させる。
    b = map(i, 0, colCount - 1, 0, 100);
    fill(fix_H, fix_S, b);
    rect(offset, originY + 2 * cellHeight, cellWidth, cellHeight);
    displayHSBText(fix_H, fix_S, b, offset, originY + 2 * cellHeight, cellWidth, cellHeight);
  }
}

function displayHSBText(h, s, b, x, y, cellWidth, cellHeight) {
  const textColor = getContrastingColor(h, s, b);
  fill(textColor);
  textAlign(LEFT, CENTER);
  textSize(14);
  text(`H: ${Math.round(h)}`, x + 5, y + cellHeight / 3);
  text(`S: ${Math.round(s)}`, x + 5, y + cellHeight / 2);
  text(`B: ${Math.round(b)}`, x + 5, y + 2 * cellHeight / 3);
}

function getContrastingColor(h, s, b) {
  return (b > 50 && s < 50) ? color(0) : color(255);
}

function mousePressed() {
  const cellWidth = RECT_WIDTH / COL_COUNT;
  const cellHeight = RECT_HEIGHT / ROW_COUNT;

  const col = floor(mouseX / cellWidth);

  if (mouseY < cellHeight) {
    fix_H = map(col, 0, COL_COUNT - 1, 0, 360);
  } else if (mouseY < 2 * cellHeight) {
    fix_S = map(col, 0, COL_COUNT - 1, 0, 100);
  } else if (mouseY < 3 * cellHeight) {
    fix_B = map(col, 0, COL_COUNT - 1, 0, 100);
  }

  drawRectangles(ORIGIN_X, ORIGIN_Y, RECT_WIDTH, RECT_HEIGHT, ROW_COUNT, COL_COUNT);
}
htmlと.jsファイルの場合
index.html
<!DOCTYPE html>
<html lang="en">
<head>
  <meta charset="UTF-8">
  <meta name="viewport" content="width=device-width, initial-scale=1.0">
  <title>Canvas Drawing</title>
  <style>
    body {
      display: flex;
      justify-content: center;
      align-items: center;
      height: 100vh;
      margin: 0;
    }
    canvas {
      border: 1px solid black;
    }
  </style>
</head>
<body>
  <canvas id="myCanvas" width="800" height="600"></canvas>
  <script src="main.js"></script>
</body>
</html>
main.js
なんか即時実行になってまっとる。
const DEFAULT_H = 0;
const DEFAULT_S = 100;
const DEFAULT_B = 100;

const ORIGIN_X = 0;
const ORIGIN_Y = 0;
const RECT_WIDTH = 500;
const RECT_HEIGHT = 150;
const ROW_COUNT = 3;
const COL_COUNT = 20;

let fix_H = DEFAULT_H;
let fix_S = DEFAULT_S;
let fix_B = DEFAULT_B;

const canvas = document.getElementById('myCanvas');
const ctx = canvas.getContext('2d');

canvas.addEventListener('click', function(event) {
  const rect = canvas.getBoundingClientRect();
  const mouseX = event.clientX - rect.left;
  const mouseY = event.clientY - rect.top;
  mousePressed(mouseX, mouseY);
});

function map(value, start1, stop1, start2, stop2) {
  return ((value - start1) / (stop1 - start1)) * (stop2 - start2) + start2;
}

function hsbToRgb(h, s, b) {
  s /= 100;
  b /= 100;
  const k = (n) => (n + h / 60) % 6;
  const f = (n) => b * (1 - s * Math.max(0, Math.min(k(n), 4 - k(n), 1)));
  return [
    Math.round(255 * f(5)),
    Math.round(255 * f(3)),
    Math.round(255 * f(1))
  ];
}

function drawRect(x, y, width, height, color) {
  ctx.fillStyle = color;
  ctx.fillRect(x, y, width, height);
}

function displayHSBText(h, s, b, x, y, cellWidth, cellHeight) {
  const textColor = getContrastingColor(h, s, b);
  ctx.fillStyle = textColor;
  ctx.textAlign = "left";
  ctx.textBaseline = "middle";
  ctx.font = "14px Arial";
  ctx.fillText(`H: ${Math.round(h)}`, x + 5, y + cellHeight / 3);
  ctx.fillText(`S: ${Math.round(s)}`, x + 5, y + cellHeight / 2);
  ctx.fillText(`B: ${Math.round(b)}`, x + 5, y + 2 * cellHeight / 3);
}

function getContrastingColor(h, s, b) {
  return (b > 50 && s < 50) ? "black" : "white";
}

function setup() {
  drawRectangles(ORIGIN_X, ORIGIN_Y, RECT_WIDTH, RECT_HEIGHT, ROW_COUNT, COL_COUNT);
}

function drawRectangles(originX, originY, rectWidth, rectHeight, rowCount, colCount) {
  const cellWidth = rectWidth / colCount;
  const cellHeight = rectHeight / rowCount;

  for (let i = 0; i < colCount; i++) {
    const offset = originX + i * cellWidth;
    let h, s, b;

    // hの値を変化させる。
    h = map(i, 0, colCount - 1, 0, 360);
    const [r1, g1, b1] = hsbToRgb(h, fix_S, fix_B);
    drawRect(offset, originY, cellWidth, cellHeight, `rgb(${r1}, ${g1}, ${b1})`);
    displayHSBText(h, fix_S, fix_B, offset, originY, cellWidth, cellHeight);

    // sの値を変化させる。
    s = map(i, 0, colCount - 1, 0, 100);
    const [r2, g2, b2] = hsbToRgb(fix_H, s, fix_B);
    drawRect(offset, originY + cellHeight, cellWidth, cellHeight, `rgb(${r2}, ${g2}, ${b2})`);
    displayHSBText(fix_H, s, fix_B, offset, originY + cellHeight, cellWidth, cellHeight);

    // bの値を変化させる。
    b = map(i, 0, colCount - 1, 0, 100);
    const [r3, g3, b3] = hsbToRgb(fix_H, fix_S, b);
    drawRect(offset, originY + 2 * cellHeight, cellWidth, cellHeight, `rgb(${r3}, ${g3}, ${b3})`);
    displayHSBText(fix_H, fix_S, b, offset, originY + 2 * cellHeight, cellWidth, cellHeight);
  }
}

function mousePressed(mouseX, mouseY) {
  const cellWidth = RECT_WIDTH / COL_COUNT;
  const cellHeight = RECT_HEIGHT / ROW_COUNT;

  const col = Math.floor(mouseX / cellWidth);

  if (mouseY < cellHeight) {
    fix_H = map(col, 0, COL_COUNT - 1, 0, 360);
  } else if (mouseY < 2 * cellHeight) {
    fix_S = map(col, 0, COL_COUNT - 1, 0, 100);
  } else if (mouseY < 3 * cellHeight) {
    fix_B = map(col, 0, COL_COUNT - 1, 0, 100);
  }

  drawRectangles(ORIGIN_X, ORIGIN_Y, RECT_WIDTH, RECT_HEIGHT, ROW_COUNT, COL_COUNT);
}

setup(); // 即時にsetup関数を実行
全体をGUI化
左上ドラッグで移動
右下ドラッグで矩形変形
const DEFAULT_H = 0;
const DEFAULT_S = 100;
const DEFAULT_B = 100;
const ROW_COUNT = 3;
const COL_COUNT = 20;

let current_H = DEFAULT_H;
let current_S = DEFAULT_S;
let current_B = DEFAULT_B;

let originX = 0;
let originY = 0;
let rectWidth = 500;
let rectHeight = 150;

let isDraggingOrigin = false;
let isDraggingSize = false;

function setup() {
  createCanvas(800, 600);
  colorMode(HSB, 360, 100, 100);
  noStroke();
}

function draw() {
  background(255);

  drawRectangles(originX, originY, rectWidth, rectHeight, ROW_COUNT, COL_COUNT);
}

function drawRectangles(originX, originY, rectWidth, rectHeight, rowCount, colCount) {
  const cellWidth = rectWidth / colCount;
  const cellHeight = rectHeight / rowCount;

  for (let i = 0; i < colCount; i++) {
    const offset = originX + i * cellWidth;
    let h, s, b;

    // hの値を変化させる。
    h = map(i, 0, colCount - 1, 0, 360);
    fill(h, current_S, current_B);
    rect(offset, originY, cellWidth, cellHeight);
    displayHSBText(h, current_S, current_B, offset, originY, cellWidth, cellHeight);

    // sの値を変化させる。
    s = map(i, 0, colCount - 1, 0, 100);
    fill(current_H, s, current_B);
    rect(offset, originY + cellHeight, cellWidth, cellHeight);
    displayHSBText(current_H, s, current_B, offset, originY + cellHeight, cellWidth, cellHeight);

    // bの値を変化させる。
    b = map(i, 0, colCount - 1, 0, 100);
    fill(current_H, current_S, b);
    rect(offset, originY + 2 * cellHeight, cellWidth, cellHeight);
    displayHSBText(current_H, current_S, b, offset, originY + 2 * cellHeight, cellWidth, cellHeight);
  }
}

function displayHSBText(h, s, b, x, y, cellWidth, cellHeight) {
  const textColor = getContrastingColor(h, s, b);
  fill(textColor);
  textAlign(LEFT, CENTER);
  textSize(14);
  text(`H: ${Math.round(h)}`, x + 5, y + cellHeight / 3);
  text(`S: ${Math.round(s)}`, x + 5, y + cellHeight / 2);
  text(`B: ${Math.round(b)}`, x + 5, y + 2 * cellHeight / 3);
}

function getContrastingColor(h, s, b) {
  return (b > 50 && s < 50) ? color(0) : color(255);
}


function mousePressed() {
  const dOrigin = dist(mouseX, mouseY, originX, originY);
  const dSize = dist(mouseX, mouseY, originX + rectWidth, originY + rectHeight);

  if (dOrigin < 10) {
    isDraggingOrigin = true;
  } else if (dSize < 10) {
    isDraggingSize = true;
  } else {
    const cellWidth = rectWidth / COL_COUNT;
    const cellHeight = rectHeight / ROW_COUNT;

    const col = floor(mouseX / cellWidth);

    if (originY<mouseY && mouseY < originY+cellHeight) {
      current_H = map(col, 0, COL_COUNT - 1, 0, 360);
    } else if (originY<mouseY && mouseY < originY+ 2 * cellHeight) {
      current_S = map(col, 0, COL_COUNT - 1, 0, 100);
    } else if (originY<mouseY && mouseY < originY+ 3 * cellHeight) {
      current_B = map(col, 0, COL_COUNT - 1, 0, 100);
    }
  }
}

function mouseDragged() {
  if (isDraggingOrigin) {
    originX = mouseX;
    originY = mouseY;
  } else if (isDraggingSize) {
    rectWidth = mouseX - originX;
    rectHeight = mouseY - originY;
  }
}

function mouseReleased() {
  isDraggingOrigin = false;
  isDraggingSize = false;
}
htmlと.jsファイルの場合
<!DOCTYPE html>
<html lang="en">
<head>
  <meta charset="UTF-8">
  <meta name="viewport" content="width=device-width, initial-scale=1.0">
  <title>Canvas Drawing</title>
  <style>
    body {
      display: flex;
      justify-content: center;
      align-items: center;
      height: 100vh;
      margin: 0;
    }
    canvas {
      border: 1px solid black;
    }
  </style>
</head>
<body>
  <canvas id="myCanvas" width="800" height="600"></canvas>
  <script src="main.js"></script>
</body>
</html>
main.js
const DEFAULT_H = 0;
const DEFAULT_S = 100;
const DEFAULT_B = 100;
const ROW_COUNT = 3;
const COL_COUNT = 20;

let current_H = DEFAULT_H;
let current_S = DEFAULT_S;
let current_B = DEFAULT_B;

let originX = 0;
let originY = 0;
let rectWidth = 500;
let rectHeight = 150;

let isDraggingOrigin = false;
let isDraggingSize = false;

const canvas = document.getElementById('myCanvas');
const ctx = canvas.getContext('2d');

canvas.addEventListener('mousedown', mousePressed);
canvas.addEventListener('mousemove', mouseDragged);
canvas.addEventListener('mouseup', mouseReleased);

function setup() {
  draw();
}

function draw() {
  ctx.clearRect(0, 0, canvas.width, canvas.height);
  drawRectangles(originX, originY, rectWidth, rectHeight, ROW_COUNT, COL_COUNT);
}

function drawRectangles(originX, originY, rectWidth, rectHeight, rowCount, colCount) {
  const cellWidth = rectWidth / colCount;
  const cellHeight = rectHeight / rowCount;

  for (let i = 0; i < colCount; i++) {
    const offset = originX + i * cellWidth;
    let h, s, b;

    // hの値を変化させる。
    h = map(i, 0, colCount - 1, 0, 360);
    const [r1, g1, b1] = hsbToRgb(h, current_S, current_B);
    drawRect(offset, originY, cellWidth, cellHeight, `rgb(${r1}, ${g1}, ${b1})`);
    displayHSBText(h, current_S, current_B, offset, originY, cellWidth, cellHeight);

    // sの値を変化させる。
    s = map(i, 0, colCount - 1, 0, 100);
    const [r2, g2, b2] = hsbToRgb(current_H, s, current_B);
    drawRect(offset, originY + cellHeight, cellWidth, cellHeight, `rgb(${r2}, ${g2}, ${b2})`);
    displayHSBText(current_H, s, current_B, offset, originY + cellHeight, cellWidth, cellHeight);

    // bの値を変化させる。
    b = map(i, 0, colCount - 1, 0, 100);
    const [r3, g3, b3] = hsbToRgb(current_H, current_S, b);
    drawRect(offset, originY + 2 * cellHeight, cellWidth, cellHeight, `rgb(${r3}, ${g3}, ${b3})`);
    displayHSBText(current_H, current_S, b, offset, originY + 2 * cellHeight, cellWidth, cellHeight);
  }
}

function drawRect(x, y, width, height, color) {
  ctx.fillStyle = color;
  ctx.fillRect(x, y, width, height);
}

function displayHSBText(h, s, b, x, y, cellWidth, cellHeight) {
  const textColor = getContrastingColor(h, s, b);
  ctx.fillStyle = textColor;
  ctx.textAlign = "left";
  ctx.textBaseline = "middle";
  ctx.font = "14px Arial";
  ctx.fillText(`H: ${Math.round(h)}`, x + 5, y + cellHeight / 3);
  ctx.fillText(`S: ${Math.round(s)}`, x + 5, y + cellHeight / 2);
  ctx.fillText(`B: ${Math.round(b)}`, x + 5, y + 2 * cellHeight / 3);
}

function getContrastingColor(h, s, b) {
  return (b > 50 && s < 50) ? "black" : "white";
}

function map(value, start1, stop1, start2, stop2) {
  return ((value - start1) / (stop1 - start1)) * (stop2 - start2) + start2;
}

function hsbToRgb(h, s, b) {
  s /= 100;
  b /= 100;
  const k = (n) => (n + h / 60) % 6;
  const f = (n) => b * (1 - s * Math.max(0, Math.min(k(n), 4 - k(n), 1)));
  return [
    Math.round(255 * f(5)),
    Math.round(255 * f(3)),
    Math.round(255 * f(1))
  ];
}

function mousePressed(event) {
  const rect = canvas.getBoundingClientRect();
  const mouseX = event.clientX - rect.left;
  const mouseY = event.clientY - rect.top;

  const dOrigin = dist(mouseX, mouseY, originX, originY);
  const dSize = dist(mouseX, mouseY, originX + rectWidth, originY + rectHeight);

  if (dOrigin < 10) {
    isDraggingOrigin = true;
  } else if (dSize < 10) {
    isDraggingSize = true;
  } else {
    const cellWidth = rectWidth / COL_COUNT;
    const cellHeight = rectHeight / ROW_COUNT;

    const col = Math.floor(mouseX / cellWidth);

    if (originY < mouseY && mouseY < originY + cellHeight) {
      current_H = map(col, 0, COL_COUNT - 1, 0, 360);
    } else if (originY + cellHeight < mouseY && mouseY < originY + 2 * cellHeight) {
      current_S = map(col, 0, COL_COUNT - 1, 0, 100);
    } else if (originY + 2 * cellHeight < mouseY && mouseY < originY + 3 * cellHeight) {
      current_B = map(col, 0, COL_COUNT - 1, 0, 100);
    }

    draw();
  }
}

function mouseDragged(event) {
  if (isDraggingOrigin) {
    const rect = canvas.getBoundingClientRect();
    originX = event.clientX - rect.left;
    originY = event.clientY - rect.top;
    draw();
  } else if (isDraggingSize) {
    const rect = canvas.getBoundingClientRect();
    rectWidth = event.clientX - rect.left - originX;
    rectHeight = event.clientY - rect.top - originY;
    draw();
  }
}

function mouseReleased() {
  isDraggingOrigin = false;
  isDraggingSize = false;
}

function dist(x1, y1, x2, y2) {
  return Math.sqrt((x1 - x2) ** 2 + (y1 - y2) ** 2);
}

window.onload = setup;
Google Colabの場合(%%html)
%%html
<!DOCTYPE html>
<html lang="en">
<head>
  <meta charset="UTF-8">
  <meta name="viewport" content="width=device-width, initial-scale=1.0">
  <title>Canvas Drawing</title>
  <style>
    body {
      display: flex;
      justify-content: center;
      align-items: center;
      height: 100vh;
      margin: 0;
    }
    canvas {
      border: 1px solid black;
    }
  </style>
</head>
<body>
  <canvas id="myCanvas" width="800" height="600"></canvas>
  <script>
    (function() {
      const DEFAULT_H = 0;
      const DEFAULT_S = 100;
      const DEFAULT_B = 100;
      const ROW_COUNT = 3;
      const COL_COUNT = 20;

      let current_H = DEFAULT_H;
      let current_S = DEFAULT_S;
      let current_B = DEFAULT_B;

      let originX = 0;
      let originY = 0;
      let rectWidth = 500;
      let rectHeight = 150;

      let isDraggingOrigin = false;
      let isDraggingSize = false;

      const canvas = document.getElementById('myCanvas');
      const ctx = canvas.getContext('2d');

      canvas.addEventListener('mousedown', mousePressed);
      canvas.addEventListener('mousemove', mouseDragged);
      canvas.addEventListener('mouseup', mouseReleased);

      function setup() {
        draw();
      }

      function draw() {
        ctx.clearRect(0, 0, canvas.width, canvas.height);
        drawRectangles(originX, originY, rectWidth, rectHeight, ROW_COUNT, COL_COUNT);
      }

      function drawRectangles(originX, originY, rectWidth, rectHeight, rowCount, colCount) {
        const cellWidth = rectWidth / colCount;
        const cellHeight = rectHeight / rowCount;

        for (let i = 0; i < colCount; i++) {
          const offset = originX + i * cellWidth;
          let h, s, b;

          // hの値を変化させる。
          h = map(i, 0, colCount - 1, 0, 360);
          const [r1, g1, b1] = hsbToRgb(h, current_S, current_B);
          drawRect(offset, originY, cellWidth, cellHeight, `rgb(${r1}, ${g1}, ${b1})`);
          displayHSBText(h, current_S, current_B, offset, originY, cellWidth, cellHeight);

          // sの値を変化させる。
          s = map(i, 0, colCount - 1, 0, 100);
          const [r2, g2, b2] = hsbToRgb(current_H, s, current_B);
          drawRect(offset, originY + cellHeight, cellWidth, cellHeight, `rgb(${r2}, ${g2}, ${b2})`);
          displayHSBText(current_H, s, current_B, offset, originY + cellHeight, cellWidth, cellHeight);

          // bの値を変化させる。
          b = map(i, 0, colCount - 1, 0, 100);
          const [r3, g3, b3] = hsbToRgb(current_H, current_S, b);
          drawRect(offset, originY + 2 * cellHeight, cellWidth, cellHeight, `rgb(${r3}, ${g3}, ${b3})`);
          displayHSBText(current_H, current_S, b, offset, originY + 2 * cellHeight, cellWidth, cellHeight);
        }
      }

      function drawRect(x, y, width, height, color) {
        ctx.fillStyle = color;
        ctx.fillRect(x, y, width, height);
      }

      function displayHSBText(h, s, b, x, y, cellWidth, cellHeight) {
        const textColor = getContrastingColor(h, s, b);
        ctx.fillStyle = textColor;
        ctx.textAlign = "left";
        ctx.textBaseline = "middle";
        ctx.font = "14px Arial";
        ctx.fillText(`H: ${Math.round(h)}`, x + 5, y + cellHeight / 3);
        ctx.fillText(`S: ${Math.round(s)}`, x + 5, y + cellHeight / 2);
        ctx.fillText(`B: ${Math.round(b)}`, x + 5, y + 2 * cellHeight / 3);
      }

      function getContrastingColor(h, s, b) {
        return (b > 50 && s < 50) ? "black" : "white";
      }

      function map(value, start1, stop1, start2, stop2) {
        return ((value - start1) / (stop1 - start1)) * (stop2 - start2) + start2;
      }

      function hsbToRgb(h, s, b) {
        s /= 100;
        b /= 100;
        const k = (n) => (n + h / 60) % 6;
        const f = (n) => b * (1 - s * Math.max(0, Math.min(k(n), 4 - k(n), 1)));
        return [
          Math.round(255 * f(5)),
          Math.round(255 * f(3)),
          Math.round(255 * f(1))
        ];
      }

      function mousePressed(event) {
        const rect = canvas.getBoundingClientRect();
        const mouseX = event.clientX - rect.left;
        const mouseY = event.clientY - rect.top;

        const dOrigin = dist(mouseX, mouseY, originX, originY);
        const dSize = dist(mouseX, mouseY, originX + rectWidth, originY + rectHeight);

        if (dOrigin < 10) {
          isDraggingOrigin = true;
        } else if (dSize < 10) {
          isDraggingSize = true;
        } else {
          const cellWidth = rectWidth / COL_COUNT;
          const cellHeight = rectHeight / ROW_COUNT;

          const col = Math.floor(mouseX / cellWidth);

          if (originY < mouseY && mouseY < originY + cellHeight) {
            current_H = map(col, 0, COL_COUNT - 1, 0, 360);
          } else if (originY + cellHeight < mouseY && mouseY < originY + 2 * cellHeight) {
            current_S = map(col, 0, COL_COUNT - 1, 0, 100);
          } else if (originY + 2 * cellHeight < mouseY && mouseY < originY + 3 * cellHeight) {
            current_B = map(col, 0, COL_COUNT - 1, 0, 100);
          }

          draw();
        }
      }

      function mouseDragged(event) {
        if (isDraggingOrigin) {
          const rect = canvas.getBoundingClientRect();
          originX = event.clientX - rect.left;
          originY = event.clientY - rect.top;
          draw();
        } else if (isDraggingSize) {
          const rect = canvas.getBoundingClientRect();
          rectWidth = event.clientX - rect.left - originX;
          rectHeight = event.clientY - rect.top - originY;
          draw();
        }
      }

      function mouseReleased() {
        isDraggingOrigin = false;
        isDraggingSize = false;
      }

      function dist(x1, y1, x2, y2) {
        return Math.sqrt((x1 - x2) ** 2 + (y1 - y2) ** 2);
      }

      setup();
    })();
  </script>
</body>
</html>
追随スライダーバー
const DEFAULT_H = 0;
const DEFAULT_S = 100;
const DEFAULT_B = 100;
const ROW_COUNT = 3;
const COL_COUNT = 10;

let current_H = DEFAULT_H;
let current_S = DEFAULT_S;
let current_B = DEFAULT_B;

let originX = 0;
let originY = 0;
let rectWidth = 500;
let rectHeight = 150;

let isDraggingOrigin = false;
let isDraggingSize = false;

let slider_H, slider_S, slider_B;

function setup() {
  createCanvas(800, 600);
  colorMode(HSB, 360, 100, 100);
  noStroke();

  slider_H = createSlider(0, 360, current_H);
  slider_S = createSlider(0, 100, current_S);
  slider_B = createSlider(0, 100, current_B);
}

function draw() {
  background(255);

  // Get values from sliders
  current_H = slider_H.value();
  current_S = slider_S.value();
  current_B = slider_B.value();

  drawRectangles(originX, originY, rectWidth, rectHeight, ROW_COUNT, COL_COUNT);
}
function drawRectangles(originX, originY, rectWidth, rectHeight, rowCount, colCount) {
  const cellWidth = rectWidth / colCount;
  const cellHeight = rectHeight / rowCount;

  for (let i = 0; i < colCount; i++) {
    const offset = originX + i * cellWidth;
    let h, s, b;

    // hの値を変化させる。
    h = map(i, 0, colCount - 1, 0, 360);
    fill(h, current_S, current_B);
    rect(offset, originY, cellWidth, cellHeight);
    displayHSBText(h, current_S, current_B, offset, originY, cellWidth, cellHeight);

    // sの値を変化させる。
    s = map(i, 0, colCount - 1, 0, 100);
    fill(current_H, s, current_B);
    rect(offset, originY + cellHeight, cellWidth, cellHeight);
    displayHSBText(current_H, s, current_B, offset, originY + cellHeight, cellWidth, cellHeight);

    // bの値を変化させる。
    b = map(i, 0, colCount - 1, 0, 100);
    fill(current_H, current_S, b);
    rect(offset, originY + 2 * cellHeight, cellWidth, cellHeight);
    displayHSBText(current_H, current_S, b, offset, originY + 2 * cellHeight, cellWidth, cellHeight);
  }

  // Position sliders just below the rectangles
  slider_H.position(30 + originX, originY + rectHeight + 10);
  slider_S.position(30 + originX, originY + rectHeight + 35);
  slider_B.position(30 + originX, originY + rectHeight + 60);

  fill(0);
  text(current_H, originX, originY + rectHeight + 20);
  text(current_S, originX, originY + rectHeight + 45);
  text(current_B, originX, originY + rectHeight + 70);
}

function displayHSBText(h, s, b, x, y, cellWidth, cellHeight) {
  const textColor = getContrastingColor(h, s, b);
  fill(textColor);
  textAlign(LEFT, CENTER);
  textSize(14);
  text(`H: ${Math.round(h)}`, x + 5, y + cellHeight / 3);
  text(`S: ${Math.round(s)}`, x + 5, y + cellHeight / 2);
  text(`B: ${Math.round(b)}`, x + 5, y + 2 * cellHeight / 3);
}

function getContrastingColor(h, s, b) {
  return (b > 50 && s < 50) ? color(0) : color(255);
}


function mousePressed() {
  const dOrigin = dist(mouseX, mouseY, originX, originY);
  const dSize = dist(mouseX, mouseY, originX + rectWidth, originY + rectHeight);

  if (dOrigin < 10) {
    isDraggingOrigin = true;
  } else if (dSize < 10) {
    isDraggingSize = true;
  } else {
    const cellWidth = rectWidth / COL_COUNT;
    const cellHeight = rectHeight / ROW_COUNT;

    const col = floor((mouseX-originX) / cellWidth);

    if (originY<mouseY && mouseY < originY+cellHeight) {
      current_H = map(col, 0, COL_COUNT - 1, 0, 360);
    } else if (originY<mouseY && mouseY < originY+ 2 * cellHeight) {
      current_S = map(col, 0, COL_COUNT - 1, 0, 100);
    } else if (originY<mouseY && mouseY < originY+ 3 * cellHeight) {
      current_B = map(col, 0, COL_COUNT - 1, 0, 100);
    }

     slider_H.value(current_H);
     slider_S.value(current_S);
     slider_B.value(current_B);
  }
}

function mouseDragged() {
  if (isDraggingOrigin) {
    originX = mouseX;
    originY = mouseY;
  } else if (isDraggingSize) {
    rectWidth = mouseX - originX;
    rectHeight = mouseY - originY;
  }
}

function mouseReleased() {
  isDraggingOrigin = false;
  isDraggingSize = false;
}